![]()
![]()
![]()
Use LEFT and RIGHT arrow keys to navigate between flashcards;
Use UP and DOWN arrow keys to flip the card;
H to show hint;
A reads text to speech;
24 Cards in this Set
- Front
- Back
|
Gender and Pay |
We want to understand the phenominal of gender and pay so we can make it go away and to reduce gender pay. We can observe out in the world that women are paid less than men and often women are paid less than men for similar levels of qualifications and similar jobs. |
|
|
Gender and Pay Diagram |
The labor market for part time workers are women and men. Its declining and the minus means women are earning more than men. Women need more flexability than men because of looking after children or elders. We can plot changes in gender pay gaps and we can split them into part time workers and full time workers as well as the entire labor market. |
|
|
Gender and Pay Diagram 2 |
We can make assumptions such as whether full time is more important than part time. Whether we have to break up all workers and put them into these categories. |
|
|
Some Big Questions |
What causes these gaps? The first task is trying to understand the causes, if we dont understand what causes these gaps, we have no hope of getting rid of them, we cant do anything to solve the problem we dont understand. How can we use this understanding to reduce them? Then you think about the policies measures we might undertake to get rid of them or whether policies are the right solution in the first place. |
|
|
Possible Explanations |
We have a relationship of gender on one side and pay on another, these are the two things we think are related and we have a series of hypothesis telling us how gender and pay might be related. One of those has to do with human capital. There are ideas about what causes gender pay disparity. One human capital is education. This means the skills that you bring to the labor market. Another explanation may be experience. This is part time vs full time work. Women move in and out of work for family reasons much more than men. Hence less labor market experience. Men have more experience than women. Less incentive to make career investments. THESE ARE HYPOTHISIS, WE DONT KNOW FOR SURE IF THESE ARE IDEAS THAT WE MAY HAVE THAT CAUSE GENDER PAY DISPARITIES. |
|
|
Possible Explanation 2 |
We can see to some extent that men and women are in different occupations and to the extent that there are systematic differences to pay in these occupations. |
|
|
Possible Explanation 3 |
We can see that gender pay disparity are small earlier on meaning even if in the thirties, gender disparities full time workers are very small but it will grow in the fourties and fifties. Men are continuing in their fourties and fifties for experience whereas women are not reaping the experience. |
|
|
Possible Explanation 4- Discrimination |
This is about prejudical attitudes held by employers or other people who are deciding about pay. Big potential cause number 1 has to do with human capital, big potential number 2 has to do with discrimination. Its just about sexism and with the same job with the same human capital, with the same hour worked. It could be that decision makers around pay are systematically being discriminatory towards female job seekers. They say yes we will give you this job but we are gonna pay you x percent LESS than an identical version of you, who just happened to be a different gender. |
|
|
Why is this important to sort out? |
Its crucial we think about whats going on so we can do something about these causes, if evidence says these are the causes, lets design policies that hit at those causes. Whereas if direct discrimination is a major cause, we need to think about how to solve that problem and how to change employers and others views. If the main cause of gender pay disparity has to do with differences in womens human capital accumulation then we might design policies that change incentives around gender balancing in human accumulation of the human capital so we can push occupations much harder and change the culture like women and science. |
|
|
Steps to Establishing Causality |
1. Show that there is an association between the cause (independent variable) and outcome (dependent variable). 2. Demonstrate that the cause (independent variable) happened before the outcome (dependent variable). 3. Rule out any other factors that could be related to the outcome (dependent variable). |
|
|
In the context of gender pay gaps- 1. Show that there is an association between the cause (independent variable) and the outcome (dependent variable) |
The main thing is the independent variable- that is doing the causing, in this case gender. The dependent variable is the thing that is affected, in this case pay. We need to show that there is a statistical association between the independent variable and the dependent variable. If they are totally unrelated to one another then the game is over, there cant be a cause of relationship if there is no relationship between gender and pay. |
|
|
In the context of gender pay gaps- 2. Demonstrate that the cause (independent variable) happened before the outcome (dependent variable). |
For example if pay is determined before we know whether the candidate is male or female, then gender cant be the cause, thete has to be a sequence, we know what the gender is and that affects pay. |
|
|
In the context of gender pay gaps- 3. Rule out any other factors that could be related to the outcome (dependent variable). |
So before we can confidentially say that gender causes differences in pay, we need to make sure we encountered for the other factirs that shapes an individual pay otherwise we cant be sure. If there is something leftover after we account for things like experience or education, then we might say what is left might be discrimination. |
|
|
What does one need to come to these conclusions? |
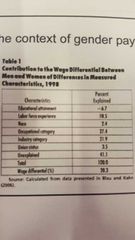
To try and create output like that table, that breaks things down and lets us sign value to different potential dibutes causes, we need appropriate data and analyse appropriately . |
|
|
Structure of Datasets |
We need to start thinking about the structure of dataset. All datasets are organized into 2 componenets. One is cases also called unit of observation and this is categories or objects that we are collecting informatiom about. The second is variables and this is features of cases about which you collect information, collecting different types of cases e.g. age, gender, occupation, pay, ethnicity, etc. Each of these are variables. |
|
|
Types of Variables |
There is a very basic step when you're thinking about how you manipulate a piece of data. Characteristics of variables determine what statistics can be used to analyse. There are two kinds of characteristics. One is how many values can a variable have? Discrete versus continuous. Second is how imformative are the values of the variable? Levels of measurement. |
|
|
Discrete vs Continuous |
Discrete: fixed number of possible values, each value is a bin or category. Categorical discrete variables means a variable can take on different values, can be sorted into bins/categories. Example: favourite chocolate digestive biscuit: McVities, Waitrose, Sainsbury, etc. Binary (also called dichotomous) discrete variables: only 2 values are possible. Example: prefer studying at night or day, male or female. |
|
|
Discrete vs Continous 2 |
One way to think about the content of variable. When we see a variable a first basic questions is what kind of variable it is, this is a discrete or continous variables. Continous: can take on any value within some intervals. Example, population density of UK Local Authorities (can have any value > 0) meaning how many people per square mile can take on any values thats morr than 0 in this case. Incomes of working age adults (how much you earn), temperature in london. |
|
|
Level of measurement: Nominal |
There are 4 types of measurement, level of measurement is another way to think about the context of the variable. The first level of measurement is Nominal this is when label/value is a "name" in other words what the variables describe as a string of tasks. Numbers are atttaches for coding, but are meaningless. Categories are mutually exclusive and exhaustive. |
|
|
Level of Measurement: Ordinal |
Next level of measurement is ordinal which menas we are still talking about the string of texts but these string of texts have a simple order to them. Categories of variable have a natural order. Indicates more or less, but not HOW much more or less. There is an order that says for example this one goes on top. |
|
|
Levels of measurement: Interval |
Interval variable is the same as ordinal but we can quantify the distance between each category. Therefore we can measure the gap between being in one category and being in another category. So it provides the same information as ordinal measures. Someone saying 'strongly agree'is twice as much as just 'agree'. |
|
|
Levels of measurement: Ratio |
Ratio and intetval is basically the same thing the only difference is that the 0 value has an instrinsic meaning. In other words it provides same information as interval but zero point is not arvbitrary and has some intrinsic meaning. You can have zero degrees but zero is not the absence of temperature when it is zero outside its not like theres no temperature. In a ratio variable, zero means the absence of that thing, e.g. height, if you are zero inches tall, we might say absence of height. |
|
|
Which level of measurement is my variable? |
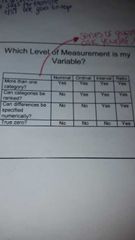
Series of questions you can ask yourself, checklist to say what kind of variables do i have, how many categories, can the differences between the categories be specified. If you answer these, you would be able to figure out, is this nominal, interval, ratio, etc. |
|
|
Why care about level of measurement? |
The reason why you care about this is because there are often lots of different ways of defining a particular variable. So if you care about pay, you can define pay as a dummy variable that says high pay or low pay or you can define pay as an continous variable that is, interval or probably ratio. Measurement levels of most variables are not inherently fixed. The higher the level of measurement, the more precise the data is, but a precise measure does not ensure accuracy. |