![]()
![]()
![]()
Use LEFT and RIGHT arrow keys to navigate between flashcards;
Use UP and DOWN arrow keys to flip the card;
H to show hint;
A reads text to speech;
74 Cards in this Set
- Front
- Back
- 3rd side (hint)
|
Selling Short |
Borrowing shares from broker to sell those shares at a high price. With the intention of buying the shares back at a lower price, and profiting from the drop. |
|
|
|
Covering Position |
When you buy back shorted shares, it is called Covering your Position. Limited amount of days before Forced Cover which follows a Liquidation Fee |
|
|
|
Short Sale Restriction (SSR) |
SSR is turned on when a stock drops more than 10% in price versus the previous days close. When Short Sale Restriction has been activated on a stock, you can only short the stock when the price is moving up. |
|
|
|
Profit Loss Ratios |

A profit/loss ratio refers to the size of the average profit compared to the size of the average loss per trade |
2:1 = 33% is your Break Even before commissions 1:1 = 50% is your Break Even before commissions 1:2 = 66% is your Break Even before commissions |
|
|
Volatility |
Volatility means greater profit or loss.
Trading Volume is a measure of how many times a stock is bought and sold in a given time period |
|
|
|
Stock Halts |
Temporary suspension of trading time.
Trading can be halted by the exchanges at any time.
Stock Halts/Trading halts are typically enacted in anticipation of a news announcement, to correct an order imbalance, as a result of a technical glitch or due to regulatory concerns.
Anytime a stock is halted, it can reopen at a much different price.
With that said there are different types of Stock Halts.. |
|
|
|
Circuit Breaker Halts |
If a stock rises or falls more than (Tier 1) 5% or (Tier 2) 10% in a 5min period, the stock can be halted for five minutes. Though doubled from 9:30 - 9:45 (Market Voliatilitly peaks) Based off the Average price/CONSTANT last 5min
Gives traders a chance to get their bearings, analyze news, and slow down.
A measure to prevent flash crash situations. Common in volatile markets. |
|
|
|
Automatic Stop Orders |
If a price falls below the stop price, your order will automatically executed by your broker and you avoid having to press the sell button yourself. |
|
|
|
Revenge Trading/Tilt |
Trying to quickly make back the losses by taking increasingly Risky Trades |
|
|
|
Former Runner |
A stock that has made huge Intraday moves in the past, or has made parabolic moves on the daily chart.
If we notice a Former Runner reporting news, it is worth keeping a close eye on it.
|
|
|
|
Float |
All stocks have Float. The Float is the number of outstanding Shares available to trade on the open market, not including shares held by insiders and the company.
The Float is the Supply |
|
|
|
Public Offering (IPO) |
Set number of Shares into the market |
|
|
|
Stock Buyback Program |
At any time, a company can begin Stock Buyback Program. Repurchasing the shares on the open market.
The result of a buyback program will be a decrease in Float and typically, an increase in Share Price. |
|
|
|
Secondary Offerings |
There are two types of secondary offerings.
1) NON-DILUTIVE A sale of securities in which one or more major stockholders in a company sell all or a large portion of their holdings. The proceeds from this sale are paid to the stockholders that sell their shares.
2) DILUTIVE Is creating new shares and offering them for public sale.
This Increases the FLOAT & decreases the VALUE (Share Price) of the stock. |
Watering the Value |
|
|
Float Rotation |
When stocks trade the entire Float of available shares. |
|
|
|
Inside Day |
When a stock trades completely inside the previous days High and Low. |
|
|
|
Stock Chart |
A visual representation of the Price History of a stock. |
|
|
|
Candlestick Charts |

Holds four pieces of Information. The high of the period The low of the period The open of the period The close of the period |
|
|
|
Doji Candlestick |
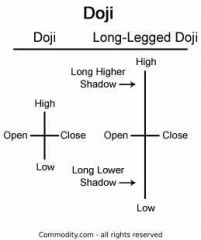
Has a very small Candle Body. Meaning the Open Price and the Close Price are nearly the same. In general, Doji Candles represent some degree of indecision in the market. |
|
|
|
Technical Indicator |
A formula that calculates current Price Action. Then tries to place the price in a context in order to help predict future Price Action. |
|
|
|
Moving Averages |
All Moving Averages are calculated as the average price of a stock over a set period of time.
Simple Moving Average (SMA) The average price over the set number of periods.
Exponential Moving Average (EMA) Takes the average over the set number of periods, but will weigh the most recent price action more heavily. |
|
|
|
Volume Weighted Average Price (VWAP) |
VWAP weighs the amount of volume that traded at each price more heavily. Weighs thr average price of the stock over the course of the day, because it factors in how many shares were traded. |
|
|
|
Cash Account |
Amount of money in account is exact.
Have to wait T (Transaction) +3 days to settle before you can use that cash again. |
|
|
|
Margin Accounts |
Requires a margin agreement. Transactions still take T+3, but instead of waiting for money to clear. Broker gives you credit. Allows for more Trades in a single day. |
|
|
|
Short Interest |
Number of shares world wide currently holding as a short position against stock.
Stocks Shorted/Float
Float = 100 shares Shorts = 10 shares (10/100) Short Interest = 10%
Stocks with a short interest of 30% or higher show risk for Short Squeezes. |
|
|
|
Short Squeeze |
A jump in stocks price forcing large number of short sellers to close their positions. In effect, pushes the price even higher. |
|
|
|
Stock Split |
A corporate action that happens when a company decides their stock price is too high (Forward) or too low (Reverse) |
|
|
|
Forward Split |
Increases the amount of Shares ..decreasing the Share Price.
Example 2:1 stock split
Shares: 10 Price: 100$
Forward Stock Split: Multiply the Shares and Divide the Price 2:1
Shares = 20 Price = 50$ |
|
|
|
Reverse Split |
Decrease the amount of Shares to increase the Share Price.
Example 1:2 Stock Split
Shares: 40 Price: 500
Reverse Stock Split: Divide the Shares and Multiply the Price. (1:2)
Shares = 20 Price = 1000$ |
|
|
|
Securities & Exchange Commission (SEC) |
Independent federal government agency responsible for protecting investors, maintaining fair and orderly functioning of securities markets and facilitating capital formation. |
|
|
|
Code T1 |
Halt requested from company, usually caused by Rumors or Pending News.
Can be up to 5 minutes, 2 hours, or even Days. |
|
|
|
Code H10 |
Halt put in place by the SEC (Securities Exchange Commission) usually because of Fraud. |
|
|
|
Tier 1 |
All exchanged traded products that average 2 million a day in daily Trades. Bands are 5-10% for stocks > 3$ |
|
|
|
Tier 2 |
All other National Market Securities. To include rights, warrants, and smaller ETP (Exchanged Traded Products) products.
Bands are 10-20% for stocks > 3$
**Don't require 2 million a day in Trading**
Not as thickly traded |
|
|
|
Standard & Poor Index (S&P 500) |
Market capitalization-weighted index of the 500 largest U.S publicly traded companies by Market Value. |
|
|
|
Market Capitalization |
Market Value of a publicly traded company. Used to classify a company’s size, which can be categorized between small, medium or large cap. Shares Outstanding × Price per share |
|
|
|
Day Trader |
The simple act of buying shares of a stock with the intention of selling them on the same day. |
|
|
|
Professional Day Trader |
Professional day trader can informally be considered somebody who day trades for a living. Day traders are not required to be licensed if they are trading their own money. |
|
|
|
Pattern Day Trader Rules |
The Pattern Day Trader (PDT) Rule states that if a trader takes 3 or more day trades in a 5 day period, they are a day trader and they must maintain a minimum account balance of $25,000 USD. Many traders who are unable to maintain that balance will trade at either a Prop Firm (see below), or at Suretrader / Tradezero. |
|
|
|
Swing Trading |
Requires overnight hold times. Swing traders will hold stocks for at least 1 night, but perhaps many nights. These are very short-term investments. |
|
|
|
Stock Market Hours |
The market is open from 9:30am -4pm EST Monday –Friday. There are holidays when the market is closed or closes at 1pm. Pre-market and after-hours trading is available but liquidity is often very low because there aren’t a lot of buyers or sellers trading after hours. |
|
|
|
Bull or Bullish |
This term refers to a strong market of stocks moving up. This can even be used to reference a specific position the trader is taking. If they are bullish, they expect the stock to go up. |
|
|
|
Bear or Bearish |
This term refers to a weak market. This means traders think the price of stocks or a specific stock will be going down. If they are bearish, they may sell their bullish positions or even take short positions. |
|
|
|
After Hours Trading |
After hours trading is done through electronic communication networks (ECNs) that are programmed to match buyers and sellers automatically and is done outside of normal market hours (930AM -4PM EST) |
|
|
|
Beta |
Beta is a numeric value that is used to measure the fluctuation of a stock against changes happening in the stock market. |
|
|
|
High Frequency Trading |
When a trader or institution utilizes powerful computers to automate trading and execute large orders an very high speeds. |
|
|
|
Freeriding |
Where an investor purchases a security and sells it before settling the original purchase. |
|
|
|
Lagging Indicator |
Technical factors known to trail the price action of an underlying security. |
|
|
|
Leading Indicator |
Refers to measurable factors of economic performance that shifts ahead of the economic cycle before it begins to follow a specific pattern. |
|
|
|
Crossed Markets |
A temporary situation where bid prices associated with a particular asset or security is higher than the asking price. |
|
|
|
Dividend |
Sum of money paid regularly (typically quarterly) by a company to its shareholders out of its profits (or reserves) |
|
|
|
Oscillators |
Indicators that are used when viewing charts that are non-trending. |
|
|
|
Divergence |
Trading concept that forms when a stock’s price diverges from a momentum oscillator which typically indicates a reversal. |
|
|
|
Earnings Per Share (EPS) |
A portion of a company’s profit allocated to a person’s share of the stock and is a major metric for analysts. |
|
|
|
NYSE Tick Index |
Calculated by taking all the stocks on NYSE that have had an uptick minus all the stocks that had a down tick and then the result is displayed on a chart. |
|
|
|
Merger |
Merger are deals that unite two separate companies into a single new company. There are a number of different types of mergers. |
|
|
|
Penny Stocks |
Any stock trading below $5 per share and can be a listed security or trade Over The Counter (OTC). |
|
|
|
Regulation T |
A collection of protocols formulated by the Federal Reserve Board that governs investors margin and cash accounts. |
|
|
|
Return on investment (ROI) |
A metric that measures profit or loss generated by an investment in relation to the invested funds. |
|
|
|
Shares Outstanding |
The stock of a company that is currently held by all shareholders including restricted shares and institutional shares. |
|
|
|
Market Trend |
Represents the general direction in a market or a security over a given period time, which can last from a couple days to many months or years. |
|
|
|
Volatility |
A measure of the security’s stability and is usually calculated as the standard deviation derived over a given period of time. |
|
|
|
Support Level |
The price level whereby demand of a security is strong enough that it prevents the decline in price past it. |
|
|
|
Resistance Level |
The price level at which selling of a security is deemed strong enough to eliminate the increase in price. |
|
|
|
Stock |
A type of asset that gives you ownership in a company, allowing you a claim on the company’s assets and earnings. |
|
|
|
Price Target |
The projected price of a financial instrument as provided by an analyst and is used determining under and overvalued stocks. |
|
|
|
Pump and Dump |
An investment scheme where untrue statements are made public about a stock with the purpose of artificially increasing the stock price |
|
|
|
Recession |
When a country’s economy experiences decline as a result of different factors over a specific period of time. |
|
|
|
Over the Counter Market (OTC) |
Allows for the trading of assets without the formal structure of an official exchange and is considered a risky area to invest. |
|
|
|
Mutual Funds |
An investment program funded by shareholders that trades in diversified holdings and is professionally managed. |
|
|
|
Hard to Borrow |
List of inventory of securities the brokerage firm is unable to provide for short selling and would only be available for buying. |
|
|
|
Cryptocurrency |
A digital currency that utilizes cryptography for security and can be sent from one person to another anywhere around the world. |
|
|
|
Derivative |
Securities with prices that are dependent on, or derived from, one or more separate underlying assets such as options or future contracts. |
|
|
|
Equity |
The difference between what your business is worth (your assets) minus what you owe on it (your debts and liabilities) |
|