![]()
![]()
![]()
Use LEFT and RIGHT arrow keys to navigate between flashcards;
Use UP and DOWN arrow keys to flip the card;
H to show hint;
A reads text to speech;
11 Cards in this Set
- Front
- Back
|
Maher et al., 2014 |
None of the models reproduce current hiatus trend, but they have reproduced all of the previous ones. 80% of hiatuses occur with negative IPO. Volcanic activity: rise since 90s cause a reduction in insulation. Low confidence in magnitude due to lack of info on aerosol interactions. Historically has increased likelihood of hiatuses. |
|
|
England et al , 2014 |
Warming hiatus due to internal variability not reproduced in models. Adding IPO (La Niña events) into models accounts for 50% of the hiatus. Evidence: stronger Walker Circulation and stronger Westerlies. Cooling effect of 0.1deg-0.2deg C in 2012. |
|
|
Huber and Knutti, 2014 |
Earth still warming but heat is being redistributed by IPO. Heat in oceans rather than atmosphere. |
|
|
Kosaka and Xie, 2013 |
Forcing models with negative IPO increases accuracy to r=0.97 |
|
|
Chen and Tung, 2014 |
MAO. Since 1999 0.69x10^23 J sequestered in deep ocean in the Atlantic + Southern Ocean (>300m depth). Positive salinity anomaly in sub-polar Atlantic in 2000 drive AMOC and deep water storage. Little change in Pacific heat storage since 1998 = little additional cooling. |
|
|
Stott, 2000 |
Human emissions of aerosols post WWII contributed to cooling from 1940-1975 |
|
|
Kaufmann et al., 2011 |
Reduction in solar activity. Solar forcing relative min. in 2009 from max in 2000. 0.10 Wm-2 difference leads to relative cooling of 0.04degC. Critique by Chen and Tung, 2014: not enough to explain hiatus. |
|
|
Flato et al., 2013 |
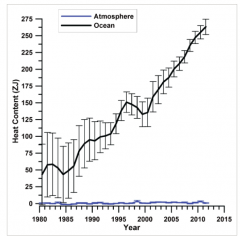
The observed global mean surface temperature (GMST) has shown a much smaller increasing linear trend over the past 15 years thanover the past 30 to 60 years. Depending on the observationaldata set, the GMST trend over 1998–2012 is estimated to be around one-third to one-half of the trend over 1951–2012. For example, in HadCRUT4 the trend is 0.04ºC per decade over 1998–2012, compared to 0.11ºC perdecade over 1951–2012. The reduction in observed GMST trend is most marked in Northern Hemisphere winter. Even with this “hiatus” in GMST trend, the decade of the 2000s has been the warmest in the instrumental record of GMST. Figure 9.8 demonstrates that 15-year-long hiatus periods are common in both the observed and CMIP5 historical GMST time series. However, an analysis of the full suite ofCMIP5 historical simulations reveals that 111 out of114 realizations show a GMST trend over 1998–2012 that is higher than the entire HadCRUT4 trend ensemble. This difference between simulated and observed trends could be caused by somecombination of (a) internal climate variability, (b) missing or incorrect radiative forcing and (c) model response error. However, it is very likely that the climate system, including the ocean below 700 m depth, has continuedto accumulate energy over the period 1998–2010. Consistent with this energy accumulation, global mean sealevel has continued to rise during 1998–2012, at a rate only slightly and insignificantly lower than during 1993–2012. Theconsistency between observed heat-content and sea level changes yields high confidence in the assessment of continued ocean energyaccumulation, which is in turn consistent with the positive radiative imbalance of the climate system. The AR5 best-estimate ERF forcing trend difference between1998–2011 and 1951–2011 might explain about one-half (0.05°C per decade) of the observed GMST trend difference betweenthese periods (0.06 to 0.08°C per decade, depending on observational data set). The discrepancy between simulated and observed GMST trends during 1998–2012 could be explained in part by a tendency for someCMIP5 models to simulate stronger warming in response to increases in greenhouse gas (GHG) concentration than is consistentwith observations. This downward scaling is, however, not sufficient to explain the model-meanoverestimate of GMST trend over the hiatus period. In summary, the observed recent warming hiatus, defined as the reduction in GMST trend during 1998–2012 as compared to the trendduring 1951–2012, is attributable in roughly equal measure to a cooling contribution from internal variability and a reduced trend inexternal forcing (expert judgment, medium confidence). The forcing trend reduction is primarily due to a negative forcing trend fromboth volcanic eruptions and the downward phase of the solar cycle. However, there is low confidence in quantifying the role of forcingtrend in causing the hiatus, because of uncertainty in the magnitude of the volcanic forcing trend and low confidence in the aerosolforcing trend. The causes of both the observed GMST trend hiatus and of the model–observation GMST trend difference during 1998–2012 implythat, barring a major volcanic eruption, most 15-year GMST trends in the near-term future will be larger than during 1998–2012. The reasons for this implication are fourfold:first, anthropogenic greenhouse-gas concentrations are expected to rise further in all RCP scenarios; second, anthropogenic aerosolconcentration is expected to decline in all RCP scenarios, and so is the resulting cooling effect; third, the trend in solar forcing isexpected to be larger over most near-term 15-year periods than over 1998–2012 (medium confidence), because 1998–2012 containedthe full downward phase of the solar cycle; and fourth, it is more likely than not that internal climate variability in the near-term willenhance and not counteract the surface warming expected to arise from the increasing anthropogenic forcing. |
|
|
Yan et al., 2016 |
One salient insight is that the GMST phenomenon is a surface characteristic that does not represent a slowdown in warming of the climate system but rather is an energy redistribution within the oceans. Improved understanding of the ocean distribution and redistribution of heat will help better monitor Earth's energy budget and its consequences. A review of recent scientific publications on the “hiatus” shows the difficulty and complexities in pinpointing the oceanic sink of the “missing heat” from the atmosphere and the upper layer of the oceans, which defines the “hiatus.” |
|
|
Black, 2011 |
The uncertainty increases massively the closer you get to the starting date of the model/measurements. E.g. if you start looking at warming in 2012 from 2005, warming ranges from -0.15 to 0.05 deg C. If you start in 1975, it is relatively constant at a bit less than 0.05. |
|
|
Dai et al., 2015 |
Despite a steady increase in atmospheric greenhouse gases (GHGs), global-mean surface temperature (T) has shown no discernible warming since about 2000, in sharp contrast to model simulations, which on average project strong warming1,2,3. The recent slowdown in observed surface warming has been attributed to decadal cooling in the tropical Pacific1,4,5, intensifying trade winds5, changes in El Niño activity6,7, increasing volcanic activity8,9,10 and decreasing solar irradiance7. Earlier periods of arrested warming have been observed but received much less attention than the recent period, and their causes are poorly understood. Here we analyse observed and model-simulated global Tfields to quantify the contributions of internal climate variability (ICV) to decadal changes in global-mean T since 1920. We show that the Interdecadal Pacific Oscillation (IPO) has been associated with large Tanomalies over both ocean and land. Combined with another leading mode of ICV, the IPO explains most of the difference between observed and model-simulated rates of decadal change in global-mean T since 1920, and particularly over the so-called ‘hiatus’ period since about 2000. We conclude that ICV, mainly through the IPO, was largely responsible for the recent slowdown, as well as for earlier slowdowns and accelerations in global-mean T since 1920, with preferred spatial patterns different from those associated with GHG-induced warming or aerosol-induced cooling. Recent history suggests that the IPO could reverse course and lead to accelerated global warming in the coming decades. |