Reading...
![]()
Play button
![]()
Play button
![]()
Use LEFT and RIGHT arrow keys to navigate between flashcards;
Use UP and DOWN arrow keys to flip the card;
H to show hint;
A reads text to speech;
173 Cards in this Set
- Front
- Back
|
Objectives of epidemiology
|
1. Identify the cause of disease
2. Determine the extent of disease 3. Study the natural history of disease 4. Evaluate preventative measures, therapies, etc. 5. Science-based public policy |
|
|
Test sensitivity
|
How well does the test identify those with disease?
|
|
|
Test specificity
|
How well does the test rule out those who do not have disease?
|
|
|
Primary prevention
|
Protecting the non-infected
|
|
|
Secondary prevention
|
Detecting the pre-clinical
|
|
|
Tertiary prevention
|
Reducing the impact of clinical disease
|
|
|
Endemic
|
The usual occurrence of a disease within a given area
|
|
|
Sporadic
|
Separate or scattered disease incidents occurring at low frequency
|
|
|
Epidemic/Outbreak
|
More disease than expected for a given time and place
|
|
|
Pandemic
|
Epidemic affecting several continents
|
|
|
Incubationary carrier
|
Pre-clinical, many organisms being shed
|
|
|
Convalescent carrier
|
Continues to harbor and shed organisms for a variable period of time following recovery
|
|
|
Transient carrier
|
Subclinical but may shed organisms for variable periods
|
|
|
Chronic carrier
|
Organisms are shed for long periods of time
|
|
|
Reservoir
|
Any animal, arthropod, plant, soil, or inanimate matter in which an infectious agent normally lives and multiplies or on which it depends primarily for survival and reproduces in such a way that it can be transmitted to a susceptible host
|
|
|
Nidus
|
A localized reservoir that persists over a very long time period
|
|
|
Vehicle
|
An object, substance, or non-receptive living being serving as an intermediary in transmitting a pathogen from the organism hosting it to a receptive host
|
|
|
Vector
|
A living creature which acquires a pathogen from one living host and transmits it to another
|
|
|
Fomite
|
An object or material that can transfer pathogens on its surface
|
|
|
Incubation period
|
The time between exposure to the pathogen and the onset of clinical signs
|
|
|
Latent infection
|
Inapparent infection that has the potential to develop signs of disease
|
|
|
Source of infection
|
The animal, person, or object from which an infectious agent passes immediately to the host
|
|
|
Intrinsic host factors
|
"From within" host factors
1. Species 2. Age 3. Breed 4. Gender 5. Physiological state 6. Disease history |
|
|
Extrinsic host factors
|
"Outside" host factors
1. Use of animal/occupation in humans 2. Husbandry in animals/socio-economic status in humans |
|
|
Infectivity
|
An agent factor
Ability of the agent to ledge and multiply within the host; minimum number of infectious particles required to establish an infectious |
|
|
Infectiousness
|
An agent factor
The ease with which the agent is transferred to another |
|
|
Pathogenicity
|
An agent factor
The ability to produce disease |
|
|
Virulence
|
An agent factor
The degree of pathogenicity; the disease-evoking power of a microorganism in a given host |
|
|
Host range
|
An agent factor
The range of hosts in which an agent can survive |
|
|
Viability
|
An agent factor
Ability of an infectious agent to survive in the environment |
|
|
Environmental factors
|
Physical aspects of the environment: temp, pressure, humidity, etc.
Biological aspects of the environment: presence of reservoirs, vectors, herd immunity |
|
|
Horizontal transmission
|
Transmission of disease among peers
|
|
|
Vertical transmission
|
Transmission of disease between generations
|
|
|
Direct transmission
|
Person to person, animal to animal, person to animal
|
|
|
Indirect transmission
|
Transmission via a common vehicle or vector
|
|
|
Expiratory droplet
|
Direct transmission
Produced by a cough or sneeze and deposited in the respiratory tract according to size |
|
|
Droplet nuclei
|
Indirect transmission
Truly airbourne, evaporated expiratory droplets and other fluids that are inhaled into the alveoli Ten times more infectious than expiratory droplets |
|
|
Disease
|
An abnormality of structure or function that interferes with the well-being of the individual animal or results in decreased production, growth, or efficiency
|
|
|
Clinical disease
|
Outward manifestation of disease (signs or symptoms)
|
|
|
Pre-clinical disease
|
Not yet clinically apparent but will be in the future
|
|
|
Subclinical disease
|
Not clinical and will not be in the future
|
|
|
Herd immunity
|
Resistance of an "at risk" population to an attack by a disease to which a large proportion of the group are immune
|
|
|
Epidemic
|
An increase in the number of cases in a given time and place over the number expected
|
|
|
Index case
|
The first recognized case of a disease in an outbreak
|
|
|
Retrospective cohort study design
|
Determine exposures among each individual in the entire population at risk and determines whether or not disease occurred in each individual
|
|
|
Case-control study design
|
Identify a group of individuals from the population at risk with the disease and find out about their exposures. Compare to a group of individuals from the same population at risk WITHOUT disease and find out about their exposures.
|
|
|
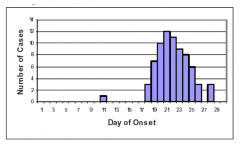
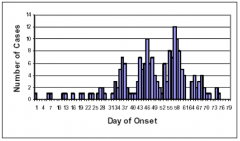
Common source outbreak with point source exposure
|
|
|
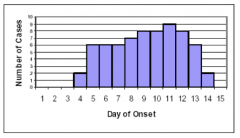
Common source outbreak with continuous exposure
|
|
|
Common source outbreak with intermittent exposure
|
|
|
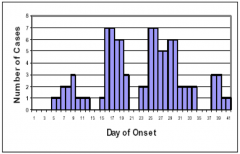
Propagated outbreak
|
|
|
Epidemiology
|
The study of how disease is distributed in populations and the factors that influence or determine the distribution
|
|
|
What is the difference between ratio, rate and proportion?
|
Ratio: numberator and denominator are mutually exclusive
proportion: have number of cases over population at risk Rate: number of cases within a unit of time over population, extremely important, gives you frequency (attack rates, intervention) |
|
|
What are three parameters we need to characterize a disease problem
|
frequency of event
frequency in reation to the popuation (relative frequency) comparing reported cases of disease from two different areas and looking for factors to affect the frequnecy of occurrence of disease |
|
|
What are the 4 items necessary to express a rate?
|
1. numerator (can only happen 1x)
2. denominator (population at risk) 3. time period (ETC, ITC) 4. location |
|
|
What is the general incidence rate?
|
number of new cases of a disease divided by the number at risk for the disease, over a given time period
|
|
|
what is cumulative incidence
|
when the entire population at risk is observed throughout a defined time period (can adjust withdrawals)
|
|
|
what is incidence density
|
when the entire population is not observed throughout the entire defined time period (exact/ave)
|
|
|
Equation for cumulative incidence no adjustments for withdrawals
|
# of new cases / initial # in population
|
|
|
equation for cumulative incidence with adjustment for withdrawals
|
# new cases/ initial NAR - .5 withdrawals
|
|
|
What does incidence density measure? What are the exact and ave equation?
|
Rate has no interpretation at individual animal level, describes the avereage velocity of occurrence.
Exact: # new cases / animal time Ave: # new cases/ (ave # at risk X ETC) |
|
|
what is the equation for primary attack rate?
|
(# sick)/(# total population in the reference/same exposure group) x 1-
|
|
|
What is secondary attack rate?
|
measure of agent infectivity, assume that secondary cases caught disease from pirmary cases
numerator: # cases which the disease occurance follows the first/primary case denominator: excludes animals who have prev had disease |
|
|
What is prevalence?
|
proportion, measure of all (not just new) cases present at a given time in the given population
|
|
|
What is specific mortality rate? vs. overall mortality rate?
|
specific: can either be cause or type specific, deaths due from disease Y / total herd
overall: death due to anything/herd |
|
|
Case fatality rate equation? what does it tell you?
|
deaths due to disease /disease cases
tells you virulence of disease |
|
|
What are the 4 biomedical study designs
|
cross-sectional-single point in time, whos case, whos not-prevalence study, retrospective
case-control-prevalence, retrospective study cohort-forward in time, will become case?,prospective, incidence clinical trial-forward in time, will become case/recover, prospective, incidence |
|
|
what is the relationship betw incidence, prevalence, and duration of disease? if you have an acute disease of short duration, what do you expect the prevalence and incidence rates to be in relation to eachother?
|
P=IxD
prevalence = incidence rate |
|
|
Crude rate
|
The rate of disease (death) in a population which ignores the effects of confounding factors, the overall rate.
|
|
|
confounding factors
|
an attribute, usually of the host, that is associated with the occurrence of exposure
|
|
|
strata
|
the different levels of a confounder
|
|
|
stratum specific rate
|
the rate of disease in each stratum
|
|
|
weighting factor
|
term that is applied to stratum specific rate to calculate a standardized rate
|
|
|
standardized rate
|
adjusted rate, overall summary of disease frequency with the effect of confounder removed
|
|
|
standardized mortality rate
|
ratio of 2 standized rates where the weighted factor is the distribution of the confounder in the observed population not the standard population
|
|
|
If factor specific rates are available, what method of adjustment of rates would you use
|
direct method
|
|
|
factorial design
|
evaluates 2 interventions compared to control in a single experiment
|
|
|
used when difficulty approaching subjects about the idea of randomization
|
group allocation design
|
|
|
what study uses a population free of disease at the beginning, some members are exposed to risk factors and some are not, then the incidence of disease is recorded as it progresses in time
|
cohort
|
|
|
Which study is prospective, involves exposure to a treatment or prevention, and uses random allocation to exposure (treatment) group
|
clinical trial
|
|
|
Which study is prospective, involves exposure to a pathogen/toxin, does not have random allocation
|
cohort study
|
|
|
how is a study population created?
|
selecting groups for inclusion in the study based on basis of whether or not they were exposed
|
|
|
how is a defined population selected
|
selected before any members were exposed. Assessment of exposure status is made at the start of study.
|
|
|
in which study does the investigator identify the population at the beginning of the study and follows them forward in calendar time until the onset/absence of disease
|
prospective cohort
|
|
|
in which study does historical data help define a pre-existing population to reduce the duration of the study?
|
retrospective cohort
|
|
|
What are the potential biases of cohort studies
|
assessment of the outcome, information bias, bias from loss of follow up, analytic bias
|
|
|
Which study should be used when the investigator has an idea of which exposures are suspected as possible causes of disease in question (good evidence of association present), and there is a significant incidence of disease?
|
cohort study is practical
|
|
|
which study involves comparing a group with the disease to a group without the disease, and exploring the proportion of cases that were exposed to the risk factor of interest and those that werent. Then determine the proportion of controls that were exposed to the risk factor and those that were not.
|
case-control study
|
|
|
what are prevalent cases
|
ones that were previously diagnosed, no waiting for cases
|
|
|
what is matching? what are the two types
|
selecting controls so that they are similiar to cases in certain characteristics (age, sex, etc).
Group matching/frequency: proportion of controls with a characteristics is equal to the proportion of cases with the characteristic Individual/pairs: for each case there is a matching control |
|
|
what study is useful for rare diseases, faster than cohort studies, inexpensive, and a useful first step in finding the cause of disease
|
case-control
|
|
|
which study surveys a defined population at a single point in time, determines exposure status and disease status at that point in time, and is a prevalence survey
|
cross sectional study
|
|
|
what study should you use to determine the prevalence of the disease in population, identify risk factors associated, is inexpensive, fast, useful for common diseases
|
cross sectional
|
|
|
which study is retrospective and begins with a defined population
|
cross sectional
|
|
|
Which study is retrospective with an undefined population
|
case control
|
|
|
which study uses cases selected by the investigator from an available pool of patients
|
case control
|
|
|
Which study uses cases that are defined by having the disease at a certain point in time (have disease = a case)
|
cross sectional
|
|
|
which study is prospective from exposure to time of development, and the population is a defined group at risk, and free of disease at beginning of monitoring period
|
cohort
|
|
|
which study has cases that are determined by those that develop the disease during the study period
|
cohort
|
|
|
which study is prospective from time of exposure to end of study, and the study population is selected and allocated into intervention and control groups by the investigator
|
controlled experiment
|
|
|
which study's cases are ones with controlled exposure to the factor
|
controlled experiment
|
|
|
which study should you use if you would like to control and monitor exposure and run a clinical trial
|
controlled experiment
|
|
|
what studies measure the frequencies of risk factor exposure among diseased and non diseased individuals
|
case control and cross sectional
|
|
|
what is an odds ratio
|
an indirect estimate of relative risk: AD/BC
|
|
|
Which studies measure the frequency of disease occurrence among those exposed to the risk factor
|
cohort and controlled expierments
|
|
|
What is relative risk
|
the ratio of the disease rate in those exposed to the rate in the non-exposed
|
|
|
What is attributable risk
|
the difference in disease rates
|
|
|
What is the formula for relative risk
|
A/A+B divided by C/C+D
|
|
|
What is the formula for attributable risk
|
A/A+B minus C/C+D
|
|
|
If the disease is rare, odds ratio may approximate relative risk in the entire population. Whats the formula
|
AD/BC
|
|
|
If the measure of risk is > 1 then ...
|
the exposure is associated with increased odds of disease
|
|
|
if the measure of risk = 1 then...
|
there is no association between the exposure and the disease
|
|
|
if the measure of risk is < 1 then ...
|
the exposure is associated with decreased odds of disease
|
|
|
how would you interpret wearing a flea collar has a relative risk for squamous cell carcinomas of 5 (RR=5)
|
cats that wear flea collars are 5 x more likely to develop SCC
|
|
|
inclusion criteria
|
common characteristics of the population
|
|
|
exclusion criteria
|
common characteristics that the members of the population lack
|
|
|
population
|
a collection of things having some quantifiable characteristic in common
|
|
|
parameter
|
numerical value that summarizes the population data
|
|
|
sample
|
group of individuals that represents the population
|
|
|
sample selection should be based on what two principles
|
random sampling and law of independence
|
|
|
confidence interval
|
sample statistic plus or minus the margin of error
|
|
|
T/F: the larger the sample, the more accurate the estimate of the parameter and the smaller the confidence interval
|
T
|
|
|
nominal scale
|
no scale, a labeling system, ex. colors
|
|
|
ordinal scale
|
ordered categories, i.e. age groups
|
|
|
interval scale
|
continuous variables with values, things you can add/subtract
|
|
|
ratio scale
|
comparison between sets of variables using different scales, commonly used with titers
|
|
|
p value
|
probability that a given outcome could occur by chance, and by chance alone
|
|
|
Positive skew appears
|
with a tail to the right
|
|
|
negative skew appears as
|
tail to the left, more common
|
|
|
mode
|
value that occurs most frequently
|
|
|
standard deviation
|
average distance of all the values from the cluster, difference btw each value and the mean is calculated and then averaged.
|
|
|
parametric tests
|
used with symmetrical, interval data
|
|
|
nonparametric tests
|
if the data is not interval/symmetrically distributed
|
|
|
describe normal distribution
|
mean = median = mode
symmetrical 68% are within 1 std deviation of the mean 95% are within 2 std deviations of the mean |
|
|
z score
|
convert everything so that the mean is always 0, and SD = 1, transforming values into a z score so the ave height would have a z score of 0.
|
|
|
Null hypothesis
|
data are result of chance variation, no difference or relationship among groups
|
|
|
alternative hypothesis
|
existing difference or relationship between groups
|
|
|
can you prove the alternative hypothesis?
|
no
|
|
|
significance level
|
the value of p at which we are willing to reject the null hypothesis (usually 5%)
|
|
|
type 1 error
|
rejecting the null hypothesis when it is true- finding a difference/relationship that is not there
|
|
|
type 2 error
|
failing to reject the null hypothesis when the alternative hypothesis is true- failing to find a difference/relationship when there is that
|
|
|
one tailed test
|
if result falls in only one of the tails, the null hypothesis is rejected
|
|
|
two tailed test
|
null hypothesis will be rejected if there is a result that falls at EITHER tail
|
|
|
When should you do the z test
|
when population standard deviation is known
|
|
|
when should you do the T-statistic test
|
comparing means between groups when the population standard deviation is not known
|
|
|
When should you do the chi-square test
|
comparing proportions in 2 or more groups
|
|
|
When should you do a binomial distribtion
|
when there are two possible outcomes
|
|
|
when does poisson distrubtion occur
|
rare events
|
|
|
what test should you do with categorical data
|
chi square test
|
|
|
what tests should you do with continuous data
|
ANOVA, kruskal-wallis
|
|
|
What test should you do with mutlivariable dataset
|
logistic/linear regression
|
|
|
power
|
probability of correctly rejecting null hypothesis when its false
|
|
|
what increases power
|
increasing sample size
|
|
|
1 or 2 tailed hypothesis: there is a statistically significant difference in the mean blood glucose levels of cats given tx 1 when compared to those given tx 2
|
2 tailed
|
|
|
1 or 2 tailed hypothesis: cats given tx 1 have significantly greater mean blood glucose level than those given tx 2
|
1 tailed
|
|
|
sensitivity
|
percentage of individuals with the disease who were positive to the test
|
|
|
specificity
|
percentage of nondiseased subjects who were negative to the test
|
|
|
false negatives
|
percentage of subjects with the disease who were neg to the test
|
|
|
false positives
|
percentage of subjects without the disease who were positive to the test
|
|
|
formula for sensitivity
|
true +/ total sick x 100
A/A+C X 100 |
|
|
formula for specificity
|
True - / total not sick x 100
D/B+D X 100 |
|
|
false neg formula
|
false neg / total sick x 100
C/A+C X 100 |
|
|
false positive formula
|
false +/total not sick x 100
B/B+D X 100 |
|
|
high cutoff value has ? sensitivity, ? specifity, ?false tests
|
low sensitivity
high specificity more false negatives |
|
|
low cutoff level: ? sensitivity, ? specificity, ? false tests
|
high sensitivity, low specificity, many false positives
|
|
|
what is sequential testing
|
when a less expensive, less invasive, high sensitivity test is done first, then those who screen positive get a more expensive, more invasive, high specificity test
|
|
|
with sequential testing, what happens to net sensitivity
|
loss of sensitivity
|
|
|
with sequential testing, what happens to net specificity
|
gain
|
|
|
what is stimultaneous testing
|
using 2 tests together, may be used when tests are not very sensitive
|
|
|
What happens to net sensitivity in simultaneous testing
|
GAIN
|
|
|
what happens to the specificity in simultaneous testing
|
LOSS
|
|
|
with simultaneous testing, should you worry more about false + or -
|
-
|
|
|
With sequential testing should you worry more about false + or -
|
+
|
|
|
what would you try to increase in a low prevalence disease to increase the positive predictive value
|
specificity
|