![]()
![]()
![]()
Use LEFT and RIGHT arrow keys to navigate between flashcards;
Use UP and DOWN arrow keys to flip the card;
H to show hint;
A reads text to speech;
43 Cards in this Set
- Front
- Back
|
AGRICULTURE |
Pre-agriculture - Hunters and gatherers - Pine nuts Caring or cultivation of plants - Farming is the practice of agriculture Domestication of plants by humans - Grains Minimal or intensive Spread from 10,000 to 2,000 years ago |
|
|
NEOLITHIC TRANSITION- Outcome |
Higher food productivity Food reserves Fewer species of plants and animals eaten - Poorer diet and nutrition - Decrease in height - Lower life expectancy - More diseases - Skeletal remains Greece and Turkey - End of ice age 5’9” 3000 BCE 5’3” Beginning of sedentary life |
|
|
Outcome continued |
Urban centers - Stratified society - Specialization of work force - Power in the hands of few Population growth- Environmental insult Is it “the worst mistake in the history ofthe human race” (Diamond 1987) or aninevitable step in the evolution of humansociety? |
|
|
WHEN DID AGRICULTURE OCCUR? |
Archaeological evidence - Around 10,000 years ago - The ratio of C12 to C13 in grasses isdifferent than other plants found inhuman bones - Fossilized plant materials - Pollen - Middens (garbage dumps) |
|
|
WHERE DID AGRICULTURE OCCUR? |
Centers of Origin (N.I. Vavilov) 1. Central Asiatic Center 2. Indian Center 3. North Indian Center 4. Near Eastern Center 5. Mediterranean Center 6. Ethiopian (formerly Abyssinian) 7. South Mexican and Central American Center8. South American Center |
|
|
WHY DID IT OCCUR? |
Environmental changes - End of ice age and large game - Higher CO2 levels that favors the growth of grains Population pressure Grain reserves and the rise of an elite group Production of alcohol from grains Cultural progress - Change in culture produced shift to agriculture False assumption that agricultural life is superior toforaging - Less work, more reliable, and more productive |
|
|
Croplands |
Replaces species rich and mature plantcommunities such as grasslands and forests |
|
|
Monoculture |
a single species crop |
|
|
Polyculture |
a mixture of crops |
|
|
KINDS OF AGRICULTURE |
- Traditional subsistence - Traditional intensive - Plantation - Sustainable - Industrialized or high input |
|
|
Interplanting |
Polyvarietal Intercropping 2 crops - grains and legumes Polyculture Many plant types Less fertilizer needed Protections from wind and water (less erosion) Less insecticides and herbicides Crop insurance against bad weather |
|
|
TRADITIONAL SUBSISTENCE AGRICULTURE |
Produce only enough food for the family Human labor Draft animals Parts of Africa, Asiaand South America |
|
|
TRADITIONAL INTENSIVE AGRICULTURE |
An increase in crop yield Feed families Income from selling excess crop More laborers and draft animals Fertilizers China and India |
|
|
PLANTATION AGRICULTURE |
Industrialized agriculture in tropicaldeveloping countries Bananas, cacao, coffee, pineapple,sugarcane, palm oil Monoculture crops Sell to developed countries |
|
|
SUSTAINABLE AGRICULTURE |
Produce food indefinitely without damageto the ecosystem Polyculture Maintain soil quality Recycle crop waste Crop rotation Legumes |
|
|
SUSTAINABLE AGRICULTURE |
Reduce carbon footprint Buy locally Sustain economic viability of farmers Can it be as productive as intensive? |
|
|
INDUSTRIAL AGRICULTURE |
Modern farming methods that depend onsynthetic fertilizers and pesticides, large amountsof irrigation water, major transportation systems,factory-style practices for raising livestock, andmachine technology. |
|
|
INDUSTRIALIZED AGRICUTURE |
Developed countries Monocultures High yields Agribusiness Production controlled by a few Large amounts of fossil fuel energy High water requirements Commercially produced fertilizers High pesticide use Use of GMO in U.S., Brazil, & Canada |
|
|
KEY INNOVATIONS |
Increasing food production Increase the yield per area (acre orhectare) U.S. 30 bushels of corn per acre in 1920 135 bushels per acre in 2000 |
|
|
KEY INNOVATIONS |
Reduced labor needs Machinery replaced draft animals Rural work force 1850 60% 1900 40% 1950 15% Current 2% |
|
|
BENEFITS OF INDUSTRIAL AGRICULTURE |
Increased yields Less expensive foods Large profitable industries Increased exports |
|
|
INCREASED YIELDS |
Green revolution in developed countries Started in 1950’s Monocultures Increased use of tractors and large farmmachinery Irrigation Large amounts of fertilizer Pesticides High yield varieties of wheat, rice and corn Increased the intensity and frequency of crops Saved over a billion people |
|
|
INCREASED YIELDS |
Green revolution in developing countries 1970’s Tropics and sub-tropics Fast growing dwarf varieties for rice andwheat Fertile soils with more fertilizer, pesticides,and water 2-3 crops per year Saves forests, wetlands and grasslands Aids biodiversity |
|
|
INCREASED YIELDS |
World grain production tripled in 50 years Per capita increased by 35% Agricultural production outpaced populationgrowth Helped reduce hunger Improved diets The possibility of human populationoutstripping food production and distribution Outcome? |
|
|
INEXPENSIVE FOOD |
U.S. most efficient agriculture in the world U.S. families spend 6-10% of disposableincome on food Farmers receive one penny of a dime 9 cents for marketing, distribution andretail |
|
|
HIDDEN COST |
Depletion of resources (fossil fuels, water,soil, and biodiversity) Pollution Economic and social costs tocommunities Subsidies (taxes) |
|
|
AGRIBUSINESS |
Large corporate agribusinesses dominate Corporate model Control genetics Control GMO Control the manufacture and distribution ofseed, fertilizers, pesticides and machinery Control processing and distribution More involved in marketing |
|
|
SUBSIDEIES |
Financial support to farmers U.S. and European governments to theiragricultural producers Distort prices and production patternsthroughout the world. By encouraging overproduction, these subsidiesdrive down world prices, forcing manydeveloping country producers to cut cornersenvironmentally or to leave world marketsaltogether |
|
|
EXPORTS |
High production levels enable exports High profits contribute to gross domesticproducts (GDP) Brazil agribusiness 30% of GDP |
|
|
U.S. FARMLAND |
COMMODITY CORN SOYBEANS WHEAT COTTON TOMATOES POTATOES GRAPES ORANGES RICE APPLES |
|
|
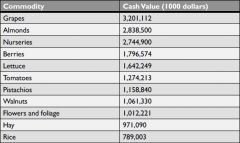
CALIFORNIA AGRICULTURE 2010 |
|
|
|
SOLE PRODUCERS OF U.S. CROPS FROM CALIFORNIA (99+%) |
Almonds Artichokes Dates Figs Grapes, Raisins Kiwifruit • Olives • Pistachios • Plums, Dried • Pomegranates • Rice, Sweet • Walnuts |
|
|
FOOD PRODUCTIONS AND POVERTY |
Declining harvests from cleared lands Push producers into surrounding wild lands richin biodiversity. The result is a cycle of increasing poverty andbiodiversity loss. Poor people forced into marginalareas Environmental impact is greater Production is lower. |
|
|
SOCIAL COST |
Agribusiness has driven out small farmers Bypass local communities in productionand marketing Deterioration of rural communities Fewer local farmers to support localbusinesses, schools, etc |
|
|
ENVIRONMENTAL IMPACTS OF FOOD PRODUCTION |
Agricultural operations can preserve andrestore critical habitats, help protectwatersheds, and improve soil health and waterquality if they are sustainably managed. When practiced without care, agriculture canpresent one of the greatest threats to speciesand the environment. |
|
|
ENVIRONMENTAL IMPACTS OF FOOD PRODUCTION |
Biodiversity loss Use of chemicals Air pollution Soil quality Water use |
|
|
ENVIRONMENTAL IMPACTS OF FOOD PRODUCTION |
Biodiversity loss Land conversions to cropland Removal of rainforests (slash and burn) Conversion of grasslands Use of monoculture crops Pesticide use and species decline |
|
|
ENVIRONMENTAL IMPACTS OF FOOD PRODUCTION |
Heavy reliance on chemicals Chemical fertilizers 20 million tons in U.S. 137 million metric tons worldwide Pesticides and herbicides 3 million tons per year worldwide Poisonings Increased cancer risks Immune, nervous and reproductive problems |
|
|
ENVIRONMENTAL IMPACTS OF FOOD PRODUCTION |
Air pollution Emissions from fossil fuels Pesticide sprays Dustbowls or desertification Slash and burn |
|
|
Decrease in soil quality |
50% of topsoil lost in past 150 years Loss of fertility Erosion Salinization Desertification |
|
|
Water use and pollution |
Consumed at unsustainable rates 2/3 of water use worldwide is devoted to irrigation Aquifer depletion Ogallala Aquifer in the Midwest San Joaquin Valley Owens Valley Desertification Salination Agricultural runoff pollutes ground and surface water Sediment pollution from erosion Contamination from pesticides, fertilizers, livestock wastes, andfood processing wastes |
|
|
Monoculture - a single species crop EXAMPLE |
Irish Potato Famine 1845-1852 Politics, landlords and middlemen forced tenants towork on small plots of land. Grew monoculture of potatoes 1/3 population depended entirely on the potato Potato blight 1 million died and I million emigrated |
|
|
ORGANIC FARMING |
Crop rotation Manure and compost Biological pest control No synthetic fertilizers No pesticides No plant growth regulators No GMO |