![]()
![]()
![]()
Use LEFT and RIGHT arrow keys to navigate between flashcards;
Use UP and DOWN arrow keys to flip the card;
H to show hint;
A reads text to speech;
25 Cards in this Set
- Front
- Back
|
Market |
A group of buyers and sellers of a particular good or service |
|
|
Competitive market |
A market in which there are many buyers and many sellers so that each has a negligible impact on the market price |
|
|
What are the main characteristics of a perfectly competitive market? |
- the goods are all the same - there are so many buyers and sellers that no single buyer or seller can influence the market price - buyers and sellers 'must accept the price the market determines,' so they are considered to be price takers. - there is free entry into and exit from the market |
|
|
Quantity demanded |
The amount of a good that buyers are willing and able to purchase |
|
|
Law of demand |
The claim that, other things being equal, The quantity demanded if a good falls when the price of the good rises |
|
|
Demand schedule |
A table that shows the relationship between the price of a good and the quantity demanded |
|
|
Demand curve |
A graph of the relationship between the price of a good and the quantity demanded |
|
|
What factors shift the demand curve? |
The ones that are not listed on the axis of the demand curve 1- income change 2- consumer preferences change 3- the prices of related goods change 4- the number of consumers change 5- consumer expectations about future prices and incomes change |
|
|
Normal good |
A good for which, all other things being equal, an increase in income causes an increase in demand |
|
|
Inferior good |
A good for which, all other things being equal, an increase in income leads to a decrease in demand |
|
|
Substitutes |
Two goods for which an increase in the price of one leads to an increase in the demand for the other ex) hotdogs and hamburgers |
|
|
Compliments |
Two goods for which an increase in the price of one leads to a decrease in demand for the other |
|
|
What is the difference between market demand and individual demand? |
Market demand is the horizontally added individual demands of all firms in the market |
|
|
Quantity supplied |
The amount of a good that sellers are willing and able to sell |
|
|
Law of supply |
The claim that, other things equal, the quantity supplied of a good rises when the price of the good rises |
|
|
Supply schedule |
A table that shows the relationship between the price of a good and the quantity supplied |
|
|
List and describe the factors that determine supply |
1. Factor or input prices- Prices of the things that go into creating the product ex) labour, ingredients etc. 2. Technology- increasing technology which increases efficiency 3. Prices of other related goods- 4. Number of sellers- if a company retires there would then be less of a supply 5. Future price expectations- if ice cream prices are expected to rise in the future it will supply less to the market expecting more pay later |
|
|
Equilibrium |
A situation in which the price has reached the level where quantity supplied equals quantity demanded |
|
|
Equilibrium price |
The price that balances quantity supplied and quantity demanded |
|
|
Equilibrium quantity |
The quantity supplied and the quantity demanded at the equilibrium price |
|
|
Surplus |
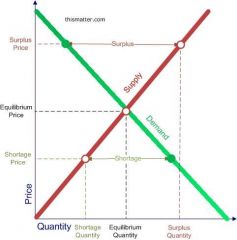
A situation in which quantity supplied is greater than quantity demanded |
|
|
Shortage |

A situation in which quantity demanded is greater than quantity supplied |
|
|
Law of supply and demand |
The claim that the price of any good adjusts to bring the quantity supplied and the quantity demanded for that good into balance |
|
|
What is the three step program for analyzing changes in equilibrium? |
1. Decide whether the event shifts the supply or demand curve (both?) 2. Decide which direction the curve shifts 3. Use the supply and demand diagram to see how the shift changes the equilibrium price and quantity |
|
|
Supply curve |
A graph of the relationship between the price of a good and the quantity supplied |