Reading...
![]()
Play button
![]()
Play button
![]()
Use LEFT and RIGHT arrow keys to navigate between flashcards;
Use UP and DOWN arrow keys to flip the card;
H to show hint;
A reads text to speech;
32 Cards in this Set
- Front
- Back
- 3rd side (hint)
|
Assimilation number
|
Assimilation number is a synonym for Pmax in equations relating photosynthetic rate to light intensity (e.g., the Jassby-Platt equation). Parsons et al. (1984 p. 73) state, “assimilation number is Pmax in the P vs. I curve.” It is expressed as the rate of photosynthetic carbon assimilation per weight of chlorophyll a and is also known as the maximum chlorophyll-specific production. Harris et al. (1989) argue that the physiological maximum assimilation number (Pmax) is
approximately 6.2 mg C (mg Chl a)^-1 h^-1. |
|
|
|
Cell quota
|
[Q, q, internal nutrient pool] The amount of nutrients per cell or per unit biomass.
|
Used in the Droop equation and some versions of the Monod equation to explain the specific growth rate [μ] of phytoplankton in terms of the internal nutrient pool. The minimum cell quota, at which μ=0, is Qsub0 in Caperon’s version of the Monod
equation and ksubq in the Droop equation. |
|
|
Chemoautotrophs
|
Bacteria that use reduced inorganic compounds
(e.g., H2S, NH4+, H2) as their energy source and fix carbon dioxide (with RuBPCO). |
|
|
|
Chemostat
|
A method of growing microbes (autotrophs or heterotrophs), in which the culture vessel volume, V, is held constant while new growth medium is added at a constant rate, I. The dilution rate, D=I/V, equals the specific growth rate μ of the microbes in the chemostat at steady state.
|
If V=250 ml, then a medium input of 173.25 ml/day would produce at a dilution rate of about 0.693 d^-1 which would be equal to the specific growth rate of the microbial population being grown in the chemostat. Note that a specific growth rate of 0.693^d-1 is equivalent to a 1-day doubling time. If the microbes were not capable of growing with specific growth rates equal to or greater than the dilution rate, they would wash out of the chemostat.
|
|
|
Competition
|
-Another widely accepted definition is that competition is the utilization by two populations of a shared resource that is demonstrably in short supply.
-There are two broad mechanisms of competition: interference competition and exploitative competition (also called scramble competition). In interference competition, one organism limits its competitor’s access to the shared resource. In exploitative competition, the resource depletion caused by one organism affects the fitness of another organism. -There are a number of models of competition, with the Lotka-Volterra model being the most famous. |
See Interspecific Competition and Intraspecific Competition slides as well
|
|
|
Interspecific Competition
|
A process in which an increase in the abundance, biomass or growth rate of one population leads to a decrease in the abundance, biomass or growth rate of another population and vice-versa.
|
|
|
|
Intraspecific Competition
|
A decrease in population growth rate caused by increased abundance, biomass or growth rate of the population (cf,. Biological interactions—classification)
|
|
|
|
Continuum concept of communities
|
Due originally to Gleason (especially Gleason 1927), and sometimes called Gleason’s individualistic view or Gleasonian dynamics. Gleason criticized Clements theories of succession, which described communities as superorganisms with a succession analogous to ontogeny. Gleason wrote that communities are not superorganisms but just collections of individuals distributed according to their own environmental requirements.
|
|
|
|
Critical Depth
|
(=Sverdrup’s critical depth) The depth above which the depth-integrated daily gross primary production equals respiration, i.e., the depth above which integrated net daily primary production equals zero. The critical depth can also be defined as the depth above which the average light intensity for the water column equals the compensation light intensity. [cf., compensation depth]
|
|
|
|
Deposit feeder
|
A benthic organism that ingests sediment particles in bulk. The food of deposit feeders can include the organic coatings on mineral grains, bacteria, microphytobenthos, detritus, and other small organisms. Subsurface deposit feeders feed on particles beneath the sediment-water interface and surface deposit feeders feed at the sediment-water interface.
|
|
|
|
Doubling time
|
ln(2) / specific growth rate = ln(2)/μ ≅ 0.693/specific growth rate [usually in days]
|
The inverse of the doubling time is denoted as Doublings per day [usually in days] = µ /ln(2)
|
|
|
Ekman mass transport
|
The depth-integrated flow resulting from the Ekman spiral.
The net transport is 90° to the right of wind direction in the Northern hemisphere and 90° to the left of wind direction in the Southern hemisphere. Ekman mass transport can lead to upwelling. |
|
|
|
El Niño
|
El Niño is a period when upwelled water is warmer than usual due to deepened sea-surface isopycnals (i.e., warm water at the Eastern ocean boundary is nearer the surface). The El Niño effects on coastal upwelling are part of an oceanic scale phenomenon known as the El Niño Southern Oscillation (ENSO), characterized by weakened easterly winds and deeper isopycnal surfaces on the Eastern boundaries of oceans and at the equatorial divergence.
|
-Named after Corriente ä Niño or ‘Current of the Christ Child’ which was an unseasonably warm current that occurred during Christmas 1892.
-Mann & Lazier (1996, p. 283) state, “In this oscillation the usual pressure gradient from the region of high atmospheric pressure in the southeast Pacific Ocean to the region of low pressure in the area of Indonesia becomes higher or lower than average. A lower-than-average pressure gradient favors El Niño conditions, while the higher-than-average situation has been called La Niña.” ENSO events affect primary production along the coast and along the equatorial divergence. They are associated with increased rainfall on the West Coast of the US and droughts inland. |
|
|
f ratio
|
The ratio of new production to total production. Eppley (1981) called (1-f) the recycling ratio.
|
|
|
|
Epipelic microphytobenthos
|
small, unicellular sediment-associated photoautotrophs, that photosynthesize on top of mud flats (pelos = mud {Greek)}. The microphytobenthis is dominated by pennate (bilateralsymmetric) diatoms.
|
In contrast episammic microphytobenthos that photosynthesize on top of sand.
|
|
|
Facilitation
|
-One of three mechanisms or models of succession proposed by Connell & Slatyer (1977).
-In all three mechanisms, there are species adapted to colonizing in higher frequency upon the opening of space in the environment. -In the facilitation model, these early species modify the environment to increase the odds of later species colonizing (often while reducing the probability that they will replace themselves). |
-In the inhibition model, early species reduce the probability of later species colonizing the area.
-In the tolerance model, the early species neither inhibit nor facilitate the recruitment of later succession species. [cf., succession, mutualism, commensalism] |
|
|
Food caching
|
Temporary sub-surface resevoir for food or feces. Could be for
storing food for later use, or for keeping it away from competitors. It's temporary storage and materials will be returned to surface at a later time. |
|
|
|
Goldberg-Koide model
|
Model for bioturbation that models local mixing.
A form of the advection-diffusion equation used to model the movement of sediment constituents such as radioisotope activities: See appendix for equation. |
Advection-diffusion equation [advection-diffusion-reaction equation] The advection-diffusion equation is the most widely used equation in all of oceanography. There are various forms of the equation in most physical and biological disciplines. In fluid dynamics, the partial differential equation with
this form is called the Navier-Stokes equation. There are equivalent forms of the equation in probability (the Kolmogorov forward equation), in population genetics (the Wright-Fisher diffusion equation), and in studies of bioturbation (the Goldberg-Koide equation). In biological oceanography, the equation describes the effects of mean flow (advection) and turbulent motion on properties of biological interest (e.g., nutrients, Chl a, phytoplankton cells). |
|
|
Hurlbert's E(S<sub>n) or Sanders-Hurlbert E(S<sub>n)
|
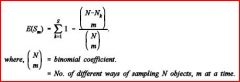
-Hurlbert's expected number of species (Hurlbert 1971)
-An index sensitive to richness and evenness |
|
|
|
Guild
|
Root (1967) introduced the term ‘guild’ to ecologists: “[A guild is] a group of species that exploit the same class of environmental resources in a similar way. This term groups together species, without regard to taxonomic positions, that overlap significantly in their niche requirements.” [cf., functional group, community]
|
|
|
|
Intermediate disturbance hypothesis
|
Paine (1966) set up controlled experiments in the Pacific Northwest rocky intertidal zone, showing that when a keystone species, the starfish Pisaster, was removed, the dominant competitor for space, the mussel Mytilus californianus, became overwhelmingly dominant, reducing diversity. Paine proposed that increasing predation or disturbance lead to enhanced species diversity by freeing limiting resources for competitively inferior species. The starfish is a keystone predator. Paul Dayton (1971, 1975) later showed that at high rates of disturbance, such as logs battering the Pacific Northwest intertidal zone, diversity declines as the community becomes dominated by only the most opportunistic species. Connell (1978) later extended the intermediate disturbance hypothesis to explain high species diversity in coral reef and tropical forest ecosystems.
|
-Local species diversity is maximized when ecological disturbance is neither too rare nor too frequent.
-According to IDH theory, at intermediate levels of disturbance, diversity is thus maximized because both competitive K-selected organisms and r-selected species can coexist. |
|
|
Liebig’s law of the minimum
|
Maximum population size, yield, or growth rate is controlled by a single limiting factor (e.g., a limiting nutrient).
|
This “hypothesis” appears to apply to the effects of nitrogen and phosphorus, which do not interact; one or the other is limiting at a time. Droop (1974) and Rhee (1978) found convincing evidence for this law in unialgal chemostat cultures: growth is controlled by one nutrient at a time. DeBaar (1994) reviews the history of this ‘law’, one of 50 agricultural laws proposed von Liebig. DeBaar (1994) concludes that this law has little validity for interpreting the complexity of complex phytoplankton communities.
|
|
|
Lotka-Volterra competition model
|
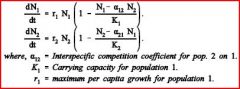
The paired, six-parameter equations that describe competition between pairs of species. The equations were introduced by Vito Volterra, but Lotka was the first to write them in their present form.
|
|
|
|
Meiofauna
|
A subset of the benthic fauna which is operationally defined as those organisms whose typical size allows them to be retained on a 63-μm mesh sieve but pass through a 500-μm (or 1-mm) mesh sieve.
|
Nematodes and harpacticoid copepods are the numerically dominant members of the meiofauna in most environments. Oligochaetes are also considered a largely meiofaunal taxon, though many individuals will be retained on a 500-μm mesh. The term meiofauna includes members that live within sediments, on sediments, and on objects protruding from the sediments (e.g., animal tubes, sea grasses, rocks). Most members of the macrofauna begin life with reproductive stages that are temporary members of the meiofauna (cf., macrofauna, mesopsammon, microfauna).
|
|
|
Microbial loop
|
1. Bacteria utilize dissolved organic matter (DOM) as an energy source [The source of DOM is from phytoplankton, perhaps mediated by zooplanktonic grazing or viral lysis]
2. Bacterial numbers are controlled by heterotrophic flagellates which can reach densities of 3x10^3 cells/ml. 3. Flagellates are preyed on by the microzooplankton in the 10 to 80 um size range (e.g., ciliates). 4. DOM is only inefficiently returned to the main food chain. |
From the web: describes a trophic pathway in the microbial food web where dissolved organic carbon (DOC) is returned to higher trophic levels via the incorporation into bacterial biomass, and coupled with the classic food chain formed by phytoplankton-zooplankton-nekton.
|
|
|
Molecular diffusive sublayer
|

-One of the benthic boundary layers (the interface between the sea floor and overlying water. There are a number of benthic boundary layers.)
-may extend from 200 μm to about 2 mm. |
|
|
|
Nitrification
|
the oxidation of nitrite [NO₂] and ammonium [NH₄⁺] to nitrate [NO₃]. This
energy-producing reaction is due almost entirely to the chemoautotrophic nitrifying bacteria. |
One group of nitrifying bacteria oxidizes ammonium to nitrite (Nitrosococcus and Nitrosomonas, and perhaps other genera) and a second group oxidizes nitrite to nitrate (e.g., Nitrobacter) (cf. denitrification & nitrate reduction)
|
|
|
Non-local mixing mode of bioturbation
|
Boudreau (1986) defines non-local mixing as benthic animal activities that displace particles distances greater than the scale over which the concentration of a tracer changes substantially.
|
Boudreau (1986) states that the term nonlocal mixing was coined by Edelen (1976) and introduced into geochemistry by Imboden. Non-local mixing is a subset of bioturbation, and conveyor-belt feeders are often non-local mixers. As defined here, non-local mixing is dependent on the type of tracer. A small deposit feeder might be a non-local mixer with respect to the short lived radioisotope Th-234 (22.4-d half life), while its feeding could be regarded as local for the longer lived isotope Pb210.
[cf., Goldberg-Koide equation] |
|
|
Redfield ratio
|
The elemental composition (by atoms, not weight!) of O:C:N:P in phytoplankton, and hence, the ratio of long-term nutrient demand and oxygen use during decomposition. The ratio also describes the ratio of C:N:P concentration in oceanic deep water, believed to be controlled by the regeneration of phytoplanktonic nutrients.
|
[= Redfield-Ketchum-Richards ratio = RKR ratio = Redfield ratio]
-The original Redfield ratio, based on Redfield (1934), was N:P in a ratio of 20:1 -Fleming (1940) introduced the now classic ratio of C:N:P.106:16:1 by atoms. The C:N:P ratio is now usually cited as 106:16:1 -Oxygen can be added giving an O:C:N:P ratio of 276:106:16:1 -For phytoplankton requiring Silica, a Si:P ratio of 8 to 12 is often assumed. -Takahashi et al. (1985) analyzed the regeneration of nutrients along deep isopycnal surfaces in the Atlantic and produced a revised Redfield ratio of 1:16:122 (±18):172 for P:N:C:O₂ -Anderson & Sarmiento (1994) analyzed 20 isopycnal surfaces and arrived at a C:N:P:O ratio of -117:16:1:-170 -Price (2005) measured the following Redfield ratio in the nutrient-replete diatom. Thalassiosira weisflogii: 97C : 14N : 4.7Si : 1P : 0.029Fe. |
|
|
Shannon's H'
|
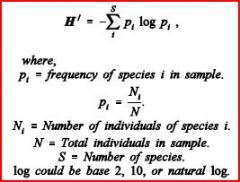
-Another index sensitive to richness and evenness
|
|
|
|
Specific growth rate (μ)
|
(e.g., 1/N dN/dt) with dimensions of t^-1
|
increase in cell mass over time
|
|
|
Subsurface chlorophyll maximum
|
maximum concentration of chlorophyll in ocean; often found at a depth between the seasonal pycnocline and permanent halocline
|
|