Reading...
![]()
Play button
![]()
Play button
![]()
Use LEFT and RIGHT arrow keys to navigate between flashcards;
Use UP and DOWN arrow keys to flip the card;
H to show hint;
A reads text to speech;
15 Cards in this Set
- Front
- Back
|
What is probability?
|
How often an event occurs compared to how often it could occur
|
|
|
What is the normal curve?
|
A family of unimodal, symmetrical, bell-shaped curves that correspond to the frequencies of many phenomena.
|
|
|
What is the relationship between probability and the normal curve?
|
The total area under the normal curve equals the probability of all possible outcomes.
|
|
|
Approximately what percent of cases fall between the mean and one standard deviation above the mean in a normal distribution?
|
34%
|
|
|
Approximately what percent of cases fall between one and two standard deviations above the mean in a normal distribution?
|
14%
|
|
|
Approximately what percent of cases fall more than two standard deviations above the mean in a normal distribution?
|
2%
|
|
|
What percent of cases fall above the mean in a normal distribution?
|
50%
|
|
|
What is a population?
|
All cases in which you are interested
|
|
|
What is a sample?
|
A subset of cases taken from a population
|
|
|
What is a non-probability sample?
|
A sample that does not rely on mathematical randomness to determine which cases are included.
|
|
|
What is a probability sample?
|
A sample that relies on mathematically random selection to determine which cases are included.
|
|
|
What is a parameter?
|
The value of a characteristic in a population (usually unknown/unknowable)
|
|
|
What is a statistic?
|
An estimate of a population parameter based on sample data
|
|
|
When finding the percent of cases above or below a z-score, add 50% to the percent you look up in table A-1 if you're looking for...
|
1. ...the percentage of cases above a negative z-score.
2. ...the percentage of cases below a positive z-score. |
|
|
How do you calculate a probability?
|
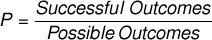
Divide the number of "successful" outcomes (i.e., those that meet your defined criteria) by the total number of possible outcomes.
|