![]()
![]()
![]()
Use LEFT and RIGHT arrow keys to navigate between flashcards;
Use UP and DOWN arrow keys to flip the card;
H to show hint;
A reads text to speech;
66 Cards in this Set
- Front
- Back
|
Operations management |
Activities related to goods and services through transformation of inputs to outputs |
|
|
Why study OM? |
-One of 3 major functions In an organization -Know how goods/services are produced -understand what operations managers do |
|
|
Jobs of Operations managers |
Design goods and services Manage quality Process/capacity design Location strategy Layout strategy Human resources/job design Supply chain management Inventory, material planning JIT Scheduling Maintenance |
|
|
Eli Whitney |
Interchangeable parts Standardization Quality control |
|
|
Fredrick W. Taylor |
Believed management should be more involved in the improvement of work methods. 1.Match employees to right job 2.Provide proper training 3.Provide proper work methods and tools 4. Have incentives for work to be done
|
|
|
Trends in operations management |
Ethics Global focus Rapid product development Environmentally sensitive production Mass customization Empowered employees Supply chain partnering Just in time performance |
|
|
Productivity |
Output/inputs Labour, material, energy, capital |
|
|
Productivity variables |
1.Labour 10% 2.Capital 38% 3.Management 52% |
|
|
Reasons service productivity is difficult to improve |
1. Typically labour intensive 2. Focused on unique individual factors 3. Often intellectual task done by professionals 4. Difficult to automate 5. Difficult to evaluate quality |
|
|
Ethical challenges |
Efficiently develop safe quality products Maintain a sustainable work environment Provide a safe work environment Honoring stakeholder commitments
|
|
|
Why companies go international |
1. Reduce costs 2. Improve supply chain 3. Provide better goods/services 4. Understand markets 5. Learn to improve operations 6. Attract and retain global talent |
|
|
Mission |
Purpose for an organizations existence |
|
|
Strategy |
Organizations action plan to achieve the mission |
|
|
Competitive advantage strategies |
Differentiation Low cost leadership Response |
|
|
Value chain analysis |
Identifies activities that represent strengths or potential strengths that add value |
|
|
Key success factors (KSFs) |
Activities or factors that are key to achieving competitive advantage |
|
|
Core competencies |
Set of unique skills, talents and capabilities a firm is strong in. |
|
|
Activity map |
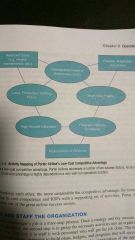
Links competitive advantage, KSFs and supporting activities. |
|
|
Global operations strategies |
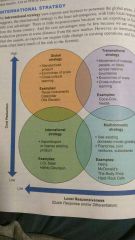
International: Global markets are penetrated using exports and licenses Multidomestic: Operating decisions are decentralized to each country to enhance local responsiveness Global: A strategy in which operating decisions are centralized, Headquarters coordinate standardization and learning Transnational: combines benefits of global scale efficiencies with benefits of local responsiveness |
|
|
Five forces model |
Analyzes competitive environment 1. Immediate rivals 2. Potential entrants 3. Customers 4. Suppliers 5. Substitute products |
|
|
Business processes |
Primary: Main value added activities. Providing service, manufacturing Support: Necessary but not value added activities. Recruitment, sales planning. Development: Improve performance of primary and support processes. Training, research, new product development |
|
|
Process map |
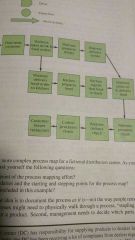
Identifies specific activities that make up a process |
|
|
Measures of process performance |
Quality Cost Time Flexibility |
|
|
Benchmarking |
Process of identifying, understanding and adapting outstanding processes to improve performance |
|
|
Root cause analysis |
Process of brainstorming possible causes of problems then narrowing the focus to root causes |
|
|
Five Ms |
Main branches of a cause-and-effect diagram
Manpower Methods Materials Machines Measurements |
|
|
Scatter plot |
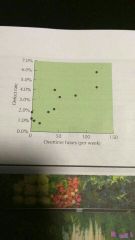
Represents the relationship between 2 variables. Typically the potential root cause and the effect of interest |
|
|
Check sheet |
Records how frequently a certain event occurs |
|
|
Pareto chart |
Bar chart that shows frequency counts from highest to lowest. Organizes errors, problems or defects to focus on problem solving. |
|
|
Histogram |
Bar chart that tracks observations falling within certain intervals |
|
|
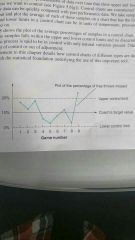
Run chart |
Shows changes of a variable over time |
|
|
Supply chain operations references (SCOR) |
A model of core management processes and individual process types that define the domain of supply chain management |
|
|
5 core management processes |
1. Source 2. Make 3. Deliver 4. Return 5. Plan |
|
|
Six Sigma process Improving an existing business process |
Define goals of improvement Measure existing process Analyze process Improve process Control the new process |
|
|
Six Sigma process Creating a completely new process |
Define Measure Analyze Design Verify |
|
|
Cycle time |
Total time needed to complete a business process
|
|
|
Percent value added time |
The percentage of total cycle time spent on value adding activities
%value added time =value added time/cycle time |
|
|
Reasons for developing new products/services |
1. Create a competitive advantage in the marketplace. 2. Provide benefits to the firm 3. Exploit existing capabilities 4. Block out competitors
|
|
|
Testability |
Ease of testing critical components or functions during production |
|
|
Serviceability |
Ease of parts being replaced, serviced or evaluated |
|
|
Robust design |
Design of products to be less sensitive to variations, including manufacturing variation and misuse. |
|
|
Engineering change |
A revision to a drawing or design to modify or correct a part. |
|
|
Development processes (CPDCL) |
Concept development: ideas for new or revised products/services Planning: address feasibility of product or service Design and development: invest in development effort, build and evaluate prototypes Commercial preparation: invest in operations and supply chain resources to support product or service Launch: Filling up supply chain with products, making service available to market. |
|
|
Sequential development process |
Product or service must clear specific hurdles before moving to the next development phase. |
|
|
Concurrent engineering |
Activities in different development stages overlap with one another, shortening total development time. |
|
|
Black box design |
Suppliers are given requirements and asked to fill in technical specifications |
|
|
Gray box design |
Supplier works with a customer to design the product |
|
|
Computer aided design (CAD) |
Information system allowing engineers to develop, modify, share and test designs virtually. |
|
|
(CAD/CAM) System |
Extension if CAD, CAD based designs are translated into machine instructions used by computer controlled manufacturing equipment |
|
|
Design for manufacturability (DFM) |
Consideration of manufacturing issues in the design and development process |
|
|
Parts Standardization |
Planned elimination of differences between similar parts in the interest of reducing part and supplier proliferation |
|
|
Design for maintainability |
Consideration of maintainability issues over a products life cycle in the design and development process. |
|
|
Design for the environment (DFE) |
Addresses environmental, safety, and health issues in the design and development process. |
|
|
Design for Six Sigma (DFSS) |
Ensures that the organization is capable of providing products or services that meet six Sigma quality of levels. 3.4 defect per million opportunities |
|
|
Design to cost/target costing |
Process of designing a product to meet specific cost objectives |
|
|
Value analysis |
Process that examine all elements of a component, an assembly, end product or service to make sure it fulfills it's intended function at the lowest total cost. |
|
|
Quality managment tools |
Check sheet Scatter diagram Cause and effect diagram Pareto chart Flow chart Histogram Control chart
|
|
|
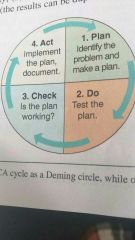
Continuous improvement model |
|
|
|
Employee empowerment |
Giving employees more responsibility. Moving authority to the lowest level possible in an organization |
|
|
Quality circle |
A group of employees who meet regularly to solve work related problems. |
|
|
Control chart |
Represents data overtime with predetermined control limits. |
|
|
Determinants of service quality |
Reliability Responsiveness Competence Access Courtesy Communication Credibility Security Knowing the customer Tangibles
|
|
|
Service recovery |
Training and empowering workers to solve a problem immediately |
|
|
ISO 9000 |
A set of quality standards developed by the International organization for standardization |
|
|
ISO 14000 |
A series of environmental management standards established by the International organization for standardization. |
|
|
Seven concepts for effective TQM |
Continuous improvement Six sigma Employee empowerment Benchmarking Just in time Taguchi concepts Knowledge of TQM tools |