![]()
![]()
![]()
Use LEFT and RIGHT arrow keys to navigate between flashcards;
Use UP and DOWN arrow keys to flip the card;
H to show hint;
A reads text to speech;
32 Cards in this Set
- Front
- Back
|
Chebyshev's Inequality |
Used to calculate minimum percentage of observations within k deviations. Can be used in non-normal distributions Minimum% = 1 - (1/k^2) |
|
|
Bond Equivalent Yield |
Twice the effective semi-annual yield. Annual Effective yield = 8%, Effective Semi-Annual Yield= 1.08^.5 = 3.923% Bond Equivalent Yield = 2 * 3.923% = 7.846% |
|
|
Bank Discount Yield |
Everything is wrong. (Discount/Face) * (360/Days to Maturity) |
|
|
Money Market Yield |
[(Ending Value - Beginning Value)/Beginning Value] * (360/Days to Maturity) |
|
|
Effective Annual Yield |
(1 + Holding Period Yield)^(365/Days to Maturity) -1 |
|
|
Holding Period Yield |
(Ending - Beginning + Cash Flows)/Beginning |
|
|
Time Weighted Return |
Takes out any effect for cash flows in and out of the account. Used if manager has no control over inflows or outflows. Annual Time Weighted Return: [(Ending 1/Beginning1)(Ending 2/Beginning 2)(Ending n/Beginning n)]^(1/n) Periods can be any length |
|
|
Money Weighted Returns |
Take account for cash flows in and out of accounts. Use if manager has control over cash flows Use CF to find IRR. IRR is interest rate per period, so period lengths must be equal, at the shortest period between signifcant cash flows. |
|
|
Continuously Compounded Rates |
Continously Compounded Rate: ln (1 + HPY) EAY with Continuous compounding: (e^i)-1 |
|
|
Lognormal Distribution |
If X is normal, e^x is lognormal. Lognormal distributions are good because they start at zero. e^x = (1 + return) |
|
|
Standard Error of Sample Mean |
A measure of the standard deviation of the distribution of sample means When Population Deviation is known: (Population Standard Deviation)/[sqrt(n)] When population deviation is unknown: (Sample Standard Deviation)/sqrt(n) |
|
|
Student's t-Distribution |
Test the mean of a normal population when population variance is unknown: (Sample Mean - Hypothesized Sample Mean)/(Sample Standard Deviation/sqrt(n)) = Number of deviations away. Determine if it is less than, greater than, or equal to critical value. Properties:
|
|
|
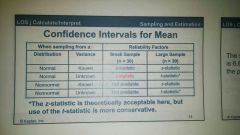
When To Use T vs. Z statistics |

|
|
|
Type II Error |
Failing to reject a false null hypothesis test. Power of test: 1 - Probability of Type II error |
|
|
Crowding Out |
Government borrowing may divert private sector investment from taking place; if there is a limited amount of savings to be spent on investment, then larger government demands will lead to higher interest rates and lower private sector investing. |
|
|
p-Value |
Smallest level of significance at which the null can be rejected, or the probability of getting the test statistic by chance if the null is true. If p-value = 2.13% Can reject null at 3% significance Cannot reject null at 1% significance |
|
|
Cost-Push vs. Demand Pull Inflation |
Cost-Push: increases in wages or other produce inputs decrease short run aggregate supply, increasing price levels Demand-Pull: Increase in aggregate demand above full employment increases price level. |
|
|
Expansionary vs. Contractionary Fiscal Policy |
Fiscal Policy: Government Decisions on taxing and spending. Expansionary: Increase spending and/or decrease taxes, increase budget deficit, increase aggregate demand Contractionary: Decrease Spending and/or increase taxes, decrease budget deficit, decrease aggregate demand. |
|
|
Expansionary vs. Contractionary Monetary Policy |
Management of the supply of money and credit. Expansionary: Increase the money supply, decrease interest rates, increase aggregate demand. Contractionary: Decrease money supply, increase interest rates, slow economic growth and inflation. |
|
|
Absolute vs. Comparative Advanatge Labor/Unit Cloth Wine England 100 110 Portugal 90 80 |
Absolute: Lower cost in terms of resources uses. Portugal has absolute advantage on both Comparative: Lower opportunity cost to produce. Makes all countries trading better off. England has comparative advantage in cloth, since they are only trading off .91 units of wine, whereas Portugal trades off 1.125 units of wine. |
|
|
Audit Opinions |
|
|
|
Financial Statement Analysis Framework |
|
|
|
9 Major Sections of GIPS |
0. Fundamentals of Compliance
|
|
|
Personal Disposable Income |
After Tax Income Personal Income - Personal Taxes Personal Income = National Income + transfer payments to households - indirect business taxes - corporate income taxes - undistributed corporate profits |
|
|
Factors That Increase Short-Run Aggregate Supply |
|
|
|
Factors That Increase Long-Run Aggregate Supply |
|
|
|
IFRS Conceptual Framework |
Two Qualitative Characteristics
|
|
|
IASB Required Financial Statements |
|
|
|
IASB Fundamental Principles |
|
|
|
IASB Presentation Requirements |
|
|
|
Characteristics of a Coherent Reporting Framework |
|
|
|
Seller of Collateral In Pool Of Securitized Assets |
Depositor |

