Reading...
![]()
Play button
![]()
Play button
![]()
Use LEFT and RIGHT arrow keys to navigate between flashcards;
Use UP and DOWN arrow keys to flip the card;
H to show hint;
A reads text to speech;
13 Cards in this Set
- Front
- Back
|
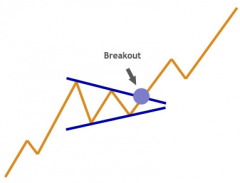
Pennant- A continuation pattern in technical analysis formed when there is a large movement in a stock, the flagpole, followed by a consolidation period with converging trend lines, the pennant, followed by a breakout movement in the same direction as the initial large movement, the second half of the flagpole.
|
|
|
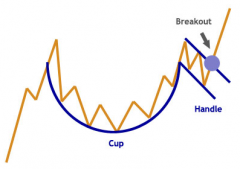
Cup and Handle- A pattern on bar charts resembling a cup with a handle. The cup is in the shape of a "U" and the handle has a slight downward drift. The right-hand side of the pattern has low trading volume. It can be as short as seven weeks and as long as 65 weeks.
As the stock comes up to test the old highs, the stock will incur selling pressure by the people who bought at or near the old high. This selling pressure will make the stock price trade sideways with a tendency towards a downtrend for four days to four weeks... then it takes off. |
|
|
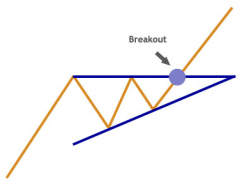
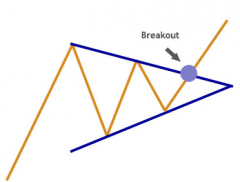
'Ascending Triangle'
A bullish chart pattern used in technical analysis that is easily recognizable by the distinct shape created by two trend lines. In an ascending triangle, one trend line is drawn horizontally at a level that has historically prevented the price from heading higher, while the second trend line connects a series of increasing troughs. Traders enter into long positions when the price of the asset breaks above the top resistance. Generally considered to be a continuation pattern. |
|
|
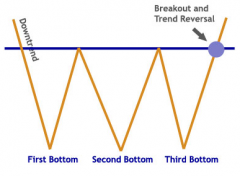
'Triple Bottom'
A pattern used in technical analysis to predict the reversal of a prolonged downtrend. The pattern is identified when the price of an asset creates three troughs at nearly the same price level. The third bounce off the support is an indication that buying interest (demand) is outweighing selling interest (supply) and that the trend is in the process of reversing. |
|
|
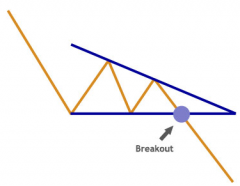
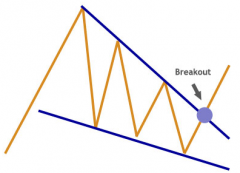
'Descending Triangle'
A bearish chart pattern used in technical analysis that is created by drawing one trend line that connects a series of lower highs and a second trend line that has historically proven to be a strong level of support. Traders watch for a move below support, as it suggests that downward momentum is building. Once the breakdown occurs, traders enter into short positions and aggressively push the price of the asset lower. |
|
|
'Inverse Head And Shoulders'
A chart pattern used in technical analysis to predict the reversal of a current downtrend. This pattern is identified when the price action of a security meets the following characteristics: 1. The price falls to a trough and then rises. 2. The price falls below the former trough and then rises again. 3. Finally, the price falls again, but not as far as the second trough. Once the final trough is made, the price heads upward toward the resistance found near the top of the previous troughs. Investors typically enter into a long position when the price rises above the resistance of the neckline. The first and third trough are considered shoulders, and the second peak forms the head. |
|
|
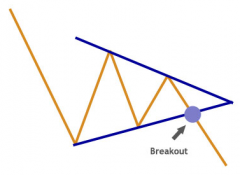
'Bullish Symmetrical Triangle'
A chart pattern used in technical analysis that is easily recognized by the distinct shape created by two converging trend lines. The pattern is identified by drawing two trend lines that connect a series of sequentially lower peaks and a series of sequentially higher troughs. Both trend lines act as barriers that prevent the price from heading higher or lower, but once the price breaches one of these levels, a sharp movement often follows. |
|

|
'Rounding Bottom'
A chart pattern used in technical analysis, which is identified by a series of price movements that, when graphed, form the shape of a "U". Rounding bottoms are found at the end of extended downward trends and signify a reversal in long-term price movements. This pattern's time frame can vary from several weeks to several months and is deemed by many traders as a rare occurrence. |
|
|
'Flag'
A technical charting pattern that looks like a flag with a mast on either side. Flags result from price fluctuations within a narrow range and mark a consolidation before the previous move resumes. Likewise, "pennant" formations are usually treated like flag formations because they are very similar in appearance, tend to show up at the same place in an existing trend, and have the same volume and measuring criteria. |
|
|
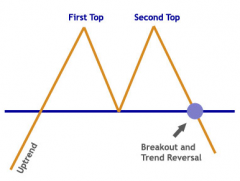
'Double Top'
A term used in technical analysis to describe the rise of a stock, a drop, another rise to the same level as the original rise, and finally another drop. |
|
|
'Bearish Symmetrical Triangle'
A chart pattern used in technical analysis that is easily recognized by the distinct shape created by two converging trend lines. The pattern is identified by drawing two trend lines that connect a series of sequentially lower peaks and a series of sequentially higher troughs. Both trend-lines act as barriers that prevent the price from heading higher or lower, but once the price breaches one of these levels, a sharp movement often follows. |
|
|
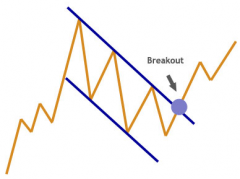
'Falling Wedge'
a wedge pointing downwards (falling wedge) is used to analyze a downward price trend within an overall upward price movement. In technical analysis, a security price pattern where trend lines drawn above and below a price chart converge into an arrow shape. Wedge shaped patterns are thought by technical analysts to be useful in analyzing a short to intermediate term reversal of what the analyst feels to be the major price trend. |
|
|
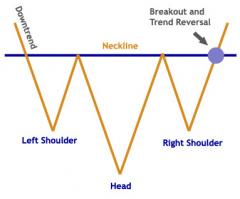
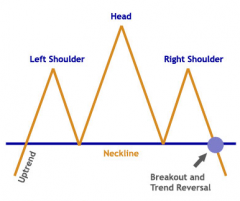
'Head And Shoulders Pattern'
A technical analysis term used to describe a chart formation in which a stock's price: 1. Rises to a peak and subsequently declines. 2. Then, the price rises above the former peak and again declines. 3. And finally, rises again, but not to the second peak, and declines once more. The first and third peaks are shoulders, and the second peak forms the head. |