Reading...
![]()
Play button
![]()
Play button
![]()
Use LEFT and RIGHT arrow keys to navigate between flashcards;
Use UP and DOWN arrow keys to flip the card;
H to show hint;
A reads text to speech;
14 Cards in this Set
- Front
- Back
|
Point Estimate
|
A summary statistic from a sample that is just one number as an estimate of the population parameter.
|
|
|
Interval Estimates
|
It conveys the range of the sample statistics we could expect if we conducted repeated hypothesis tests using samples from the same population
"casting a net in hopes to capture the whole dartboard" |
|
|
Confidence Interval
|
A calculated interval estimate that surrounds the point estimate
|
|
|
Confidence Interval Steps
|
Step 1: Draw the curve and mark the sample mean in the middle
Step 2: Indicate the bounds of the confidence interval on both ends, and color in the approximate percentages under each segment of the curve Step 3: Look up z- value for upper and lower ends of the confidence interval Step 4: Convert the z-values to raw scores for both the upper and lower ends of the curve Step 5: Check your work Upper - middle= same Lower- middle= same |
|
|
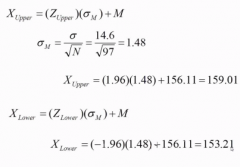
Confidence Interval Step 4 Calculations....
|
|
|
|
Effect Size Definition
|
Amount 2 populations do not overlap
larger effect size- more significant(most likely) sometimes small can too |
|
|
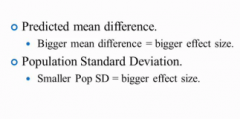
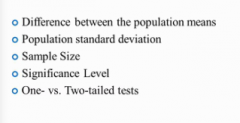
Things that influence effect size
|
|
|
|
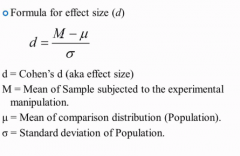
Formula for effect size
|
|
|
|
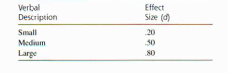
Summary for Cohen's Effect Size Conventions for Mean Differences
|
|
|
|
P rep
|
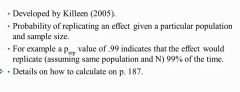
Step 1: look up the percentage using the z- statistic
Step 2: if two tailed, double the percentage Step 3: Divide by 100 |
|
|
Statistical Power
|
Probability that the study will produce a statistically significant result if the research hypothesis is true
Probability you will not make a type 2 error helps plan future studies, helps evaluating results of studies |
|
|
Calculating Statistical Power
|
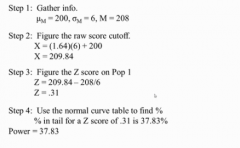
Percent above the mean
|
|
|
What Influences Power
|
Smaller standard deviations give you more power than larger standard deviations
Larger the sample size more power Less stringent the significance level (.05 less stringent than .01 ) the greater the power One tailed test have more power than two tailed test for a result in the predicted direction One tailed is less extreme cut off score than a two tailed test ZERO power for a result in the opposite direction using a one tailed test |
|
|
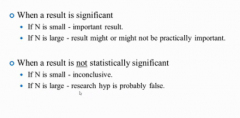
Importance of Power in Interpreting Results
|
|