![]()
![]()
![]()
Use LEFT and RIGHT arrow keys to navigate between flashcards;
Use UP and DOWN arrow keys to flip the card;
H to show hint;
A reads text to speech;
84 Cards in this Set
- Front
- Back
|
Statistics |
The study of how to collect, organize, analyze, and interpret numerical information from data |
|
|
Individuals |
People or objects included in the study |
|
|
Variable |
A characteristic of the individual to be measured or observed |
|
|
Quantitative Variable |
Has a value or numerical measurment |
|
|
Qualitative Variable |
Describes individual by putting them in a category or group |
|
|
Population data |
Data from every individual of interest |
|
|
Sample Data |
Data from only some of the individuals of interest |
|
|
Parameter |
A numerical measure that describes an aspect of a population |
|
|
Statistic |
A numerical measure that describes an aspect of a sample |
|
|
Nominal Level Of Measurement |
Data that consists of names, labels, or categories. Data can't be ordered |
|
|
Ordinal Level of Measurment |
Data that can be arranged in order. Differences between data values cannot be determined or are meaningless |
|
|
Interval Level of Measurement |
Data that can be arranged in order. Differences between data values are meaningful |
|
|
Ratio Level of Measurement |
Data that has a true zero |
|
|
Simple Random Sample |
A sample in which every individual in the population has an equal chance to be selected |
|
|
Simulation |
A numerical representation of a real world phenomenon (using numbers to represent real world objects) |
|
|
Stratified Sampling |
Divide pop. Into subgroups - pull individuals from each group to make a sample |
|
|
Systematic Sampling |
Sequentially number all individuals then from a randomly selected starting point take every Kth number |
|
|
Cluster Sampling |
Divide pop. Into clusters - choose random cluster - Use entire cluster for data |
|
|
Multistage Sampling |
Use a variety of sampling methods to create successively smaller groups at each stage. The final sample consists of clusters |
|
|
Convenience Sampling |
Create a sample by using data from population members that are readily available |
|
|
Census |
Measurements or observations from the entire population |
|
|
Observational Study |
Conducted in a a way that doesn't change the response or the variable being measured |
|
|
Experiment |
A treatment that is deliberately imposed on the individuals |
|
|
Placebo Effect |
When the subject receives no treatment but believes they have and react favorably |
|
|
Completely Randomized Experiment |
In which a random process is used to assign each individual to one of the treatments |
|
|
Block |
A group of individuals who share a common feature that might influence the treatment |
|
|
Randomized block experiment |
Individuals are sorted into blocks. A random number table Is used to assign each individual in the block to one of the treatments |
|
|
Control Group |
Receives dummy treatment |
|
|
Lurking variable |
Variable for which no data has been collected but it has other variables in the study |
|
|
Confounding variable |
When effects of one variable cannot be distinguished from The others |
|
|
Hidden Bias |
When the question is worded in a way to elicit a specific reponss |
|
|
Vague Wording |
Words such as often,seldom, or occasionally which can mean different things to different people |
|
|
Interviewer Influence |
When things such as tone of dress, voice, ethnicity, ect. Of the interviewer influences response |
|
|
Voluntary response |
When individuals with strong feelings on a subject are more likely to respond |
|
|
Frequency table |
Partitions data into classes or intervals and shows how many data values are in each class. The classes or intervals are constructed so that each data value falls into exactly one class |
|
|
Class lower limit |
Lowest Data value in a class |
|
|
Class upper limit |
Highest data value in a class |
|
|
Class width |
The difference between the lower class limit for one class and the lower class limit of the next one |
|
|
Class frequency |
The number of values in a class |
|
|
Class midpoint |
The average between the lower class limit and the upper limit |
|
|
Upper class boundary |
The upper class limit plus 0.5 |
|
|
Lower Class bundary |
The lower limit - 0 5 |
|
|
Relative Frequency |
Frequency divided by sample size |
|
|
Histogram |
Bad chart whee the width of the bar equals the class width and the height of the bar equals the class frequency |
|
|
Relative frequency histogram |
When the relative frequency is used as height |
|
|
Mound shaped symmetrical histogram |
If the 2 sides of a histogram are symmetric |
|
|
Uniform or regular distrabution |
Every class has about the same frequency |
|
|
Skewed left distrabution |
Tail on left |
|
|
Skewed right distribution |
Take on right |
|
|
Bimodal distrabution |
Histogram has 2 peaks |
|
|
Outlier |
Values that are far away from the rest of the data |
|
|
Bar graph |
A graph that displays data using bars |
|
|
Clustered bar graph |
The bars are grouped. has a key |
|
|
Pareto chart |
Bar chart where bar height represent a frequency and the bars are arranged from left to right in order of decreasing height |
|
|
Circle graph |
Wedges of A circle display proportional parts of a total population that share a common characteristic |
|
|
Time series graph |
Data is plotted in order of occurrence at regular intervals over a period of time |
|
|
Stem and leaf display |
A method of exploratory data analysis that is used to rank-order and arrange data into groups |
|
|
Mode |
The number that occurs most often |
|
|
Median |
The central value of the ordered data |
|
|
Mean |
The sum of all data values divided by the number of data values |
|
|
Resistant measure |
Measure not influenced by outliers |
|
|
Trimmed mean |
Removes the smallest and largest data values before calculating the mean |
|
|
Weighted average |
When weight (importance) is assigned to data values |
|
|
Range |
the largest value in The data minus the smallest data value |
|
|
Sample mean symbol |
X bar |
|
|
Sample variance symbol |
S squared |
|
|
Population mean symbol |
μ |
|
|
Population variance symbol |
O squared |
|
|
Population standard deviation symbol |
O |
|
|
Coefficient of variation |
A standardized measure of dispersion of a probability |
|
|
Chebyshev's theorem |
1-(1 divided by k squared) |
|
|
Percentile |
The Pth percentile of a distribution is A value such that P% of the data fall at or hello it and (100-P)% of the data fall at or above it |
|
|
Quartiles |
Values that divide the day into four pieces |
|
|
Interquartile range |
Q3-Q1 |
|
|
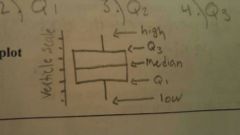
Five number summary |
1) Lowest number 2) Q1 3) Q2 4) Q3 5) highest number |
|
|
Box an whisker plot |
|
|
|
Scatter diagram |
A graph where data points are plotted as individual points on a grid |
|
|
Explanatory variable |
X |
|
|
Response variable |
Y |
|
|
Correlation coefficient |
A numerical value that measures the strength of a linear relationship between. Two variables |
|
|
Least squared line |
The sum of the squares of the vertical distance from x and y to the line is made as small as possible |
|
|
Interpolation |
Predicting y carrot values for x values between The observed x values |
|
|
Extrapolation |
Predicting y carrot beyond the observed x values |
|
|
Coefficient of determination |
r squared |