![]()
![]()
![]()
Use LEFT and RIGHT arrow keys to navigate between flashcards;
Use UP and DOWN arrow keys to flip the card;
H to show hint;
A reads text to speech;
12 Cards in this Set
- Front
- Back
|
Probability Model |
A description of how a statistician thinks data are produced |
|
|
Probability Distribution |
A tool that helps us by keeping track of the outcomes of a random experiment and the probabilities associated with those outcomes |
|
|
Discrete Outcomes |
Numerical variables that you can list or count |
|
|
Continuous Outcomes |
Outcomes that can't be listed or counted because they occur over a range |
|
|
Probability Density Curve |
The area under the curve |
|
|
Mean & Standard Deviation of a probability Distribution |
"mew" & "sigma" |
|
|
Standard Normal Model |
Model with 0 - 1 Mean = 0 St. Dev = 1 |
|
|
Binomial Formula |
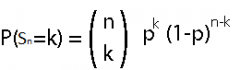
|
|
|
How to tell if something is binomial? |
1. Has a fixed # of trials (n) 2. Only 2 outcomes are possible 3. The prob of success is the same each trial 4. Trials are independent |
|
|
Binomial Probability Notation |
b(n, p, x) Probability of getting x successes with n trials and probability of success p. |
|
|
How do you find the mean for a binomial? |
"mew" (mean) = np |
|
|
How do you find the St. Dev for a binomial |
"sigma" (St. Dev) = (np)(1-p) then take the square root of this biotch |