![]()
![]()
![]()
Use LEFT and RIGHT arrow keys to navigate between flashcards;
Use UP and DOWN arrow keys to flip the card;
H to show hint;
A reads text to speech;
19 Cards in this Set
- Front
- Back
|
Mean |
Add up all the numbers, then divide by how manynumbers there are |
|
|
Median |
Place the numbers in value order and find themiddle number (or the mean of the middle two numbers) |
|
|
Mode |
Place the numbers in value order then count howmany of each number. The Mode is the number which appears most often (there canbe more than one mode
|
|
|
Range |
Difference between the lowest and highest values
{4, 6, 9, 3, 7} 9-3=6 |
|
|
Standard Deviation σ |
Measure of how spread out numbers are, formulais the square root of the Variance |
|
|
Variance |
Average of the squareddifferences from the mean Work out the Mean (the simple average of thenumbers) Then for each number: subtract the Mean andsquare the result (the squared difference). Then work out the average of those squareddifferences. |
|
|
Scatterplots |
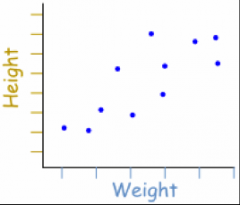
A Scatter (XY) Plot has points that show therelationship between two sets of data |
|
|
Pearson’s Coefficient of Correlation |
Step 1: Find the mean of x, and the mean of y Step 2: Subtract the mean of x from every xvalue (call them "a"), do the same for y (call them "b") Step 3: Calculate: a × b, a2and b2 for every value Step 4: Sum up a × b, sum up a2and sum up b2 Step 5: Divide the sum of a × b by the squareroot of [(sum of a2) × (sum of b2)] |
|
|
Probability |
How likely something is to happening Probability of something happening = Number of ways it can happen / Total number of outcomes |
|
|
Event |
One or more outcomes Getting a Tail when tossing a coin Choosing a "King" from a deck of cards(any of the 4 Kings) Rolling an even number |
|
|
Sample Space |
All the possible outcomes of an experiment Choosing a card from a deck = There are 52 cardsin a deck (not including Jokers). So the Sample Space is all 52 possiblecards: {Ace of Hearts, 2 of Hearts, etc... } |
|
|
Compound Event |
Combines at least two simple events If you toss two coins, the probability ofgetting 2 heads |
|
|
Independent Event |
Not effected by previous events You toss a coin and it comes up"Heads" three times ... what is the chance that the next tosswill also be a "Head"? We can calculate the probability of 2 or more Independentevents by multiplying |
|
|
Dependent Event |
What happens depends on what happened before Taking colored marbles from a bag: as you takeeach marble there are less marbles left in the bag, so the probabilities change |
|
|
Complementary Event |
All events that are NOT the event When the event is Heads,the complement is Tails |
|
|
Conditional Event |
Dependent event that occurs only if anotherevent (on which it depends) has occurred. |
|
|
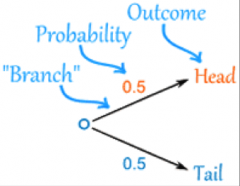
Tree Diagram |
|
|
|
Permutations |
An ordered combination - Order matters With repetition: nr Without repetition – choices get reduced eachtime -Use factorial 5! = 5*4*3*2*1 |
|
|
Combinations |
Order doesn’t matter With repetition Without repetition |