Reading...
![]()
Play button
![]()
Play button
![]()
Use LEFT and RIGHT arrow keys to navigate between flashcards;
Use UP and DOWN arrow keys to flip the card;
H to show hint;
A reads text to speech;
25 Cards in this Set
- Front
- Back
|
Statistics
|
Facts and figures; set of methods and rules fororganizing, summarizing, and interpreting information
|
|
|
Population
|
The set of all individuals of interest in aparticular study; absolutely every measure that could fit into that measure
|
|
|
Explanatory Variable
|
if one variable is used to understand or predict values of anothervariable.
|
|
|
Response Variable
|
the variable that is predicted because of the explanatory variable.
|
|
|
Simple Random Sample
|
When choosing a simple random sample of n units, all groups of size n inthe population have the same chance of becoming the sample, each unit of thepopulation has an equal chance of being selected, regardless of the other unitschosen for the sample.
|
|
|
Parameter
|
Value that we obtain from the larger populationthat represents the population; a parameter can never be derived from a sample
|
|
|
Descriptive Statistics
|
Methods for organizing, summarizing, andsimplifying data
|
|
|
Inferential Statistics
|
Takes information from a sample and makesinferences about the entire population
|
|
|
Level of Measurements
|
|
|
|
Real Limits
|
Each score has two real limits, one at the topof its interval and one at the bottom of its interval, halfway up and down fromthe next interval; e.g., the real limits of 100.29 are 100.285 &100.295
|
|
|
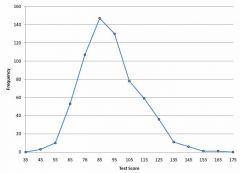
Histogram
|
|
|
|
Frequency Polygram
|
|
|
|
Deviation Score
|
locationof the score from the mean
|
|
|
Variance
|
averagesum of squares; the mean squared deviation
|
|
|
Semi-Quartile Range
|
the middle 50% of the distribution
|
|
|
Standard Deviation
|
positivesquare root of the variance
|
|
|
Single Sample Designs
|
Data from a single sample are used to test ahypothesis about a single population
|
|
|
Independent Measure Designs
|
A separate sample is obtained to represent eachindividual population or treatment condition.
|
|
|
Related-Sample Design
|
In repeated measures, there is only one sample,with each individual subject being measured in all of the different treatmentconditions; in a matched subjects design, every individual in one sample ismatched with a subject in each of the other samples
|
|
|
Type I and II Error
|
Type I error: Alpha error; error of rejection a truehypothesis
Type II error: Beta error; failing to reject a false hypothesis |
|
|
Linear Regression
|
Purpose is to find the equation for thebest-fitting straight line for predicting Y scores from X scores; regressionprocess determines the linear equation with the least squared error between theactual Y values and the predicted Y values on the line
|
|
|
Chi Square Test for Goodness of Fit
|
Used in situations where the measurementprocedure results in classifying individuals into distinct categories; testuses frequency data from a single sample to test a hypothesis about the populationdistribution; null hypothesis specifies the proportion or percentage of thepopulation for each category in the scale of measurement
|
|
|
Standard Error of Estimate
|
Provides a measure of the standard distance (orerror) between the actual Y values and the predicted Y values
|
|
|
Properties of Z-Score
|
|
|
|
Central Limit Theorem
|
First, it describes the distribution of samplemeans for any population, no matter what shape, or mean, or standard deviation.Second, the distribution of sample means “approaches” a normal distributionvery rapidly. With an n = 30, the distribution is almost perfectly normal.
|