![]()
![]()
![]()
Use LEFT and RIGHT arrow keys to navigate between flashcards;
Use UP and DOWN arrow keys to flip the card;
H to show hint;
A reads text to speech;
70 Cards in this Set
- Front
- Back
|
Explain why Colorado is probably doing better than Alabama in education despite the fact Alabama has a higher SAT average than Colorado? |
a higher percent take the SAT in Colorado |
|
|
Our scatter plot of states with percent taking SAT and SAT average would probably show what if we colored the southern states’ dots a different color 70 years ago? |
the Southern states would be towards the bottom |
|
|
Our scatter plot of states with percent taking SAT and SAT average would probably show what if we colored the southern states’ dots a different color today? |
the Southern states are mixed in well with the other states |
|
|
What is the notation for the sample linear correlation coefficient? |
r |
|
|
What is the notation for the population correlation coefficient? |
|
|
|
What does the least squares line minimize? |
sum of the squares of the vertical distances from the points to the line |
|
|
What happens if you switch x and y when finding correlation? |
nothing |
|
|
What happens if you switch x and y when finding the regression line? |
different result |
|
|
What happens to r if the units of measurement on x and/or y are changed? |
nothing |
|
|
Why does not r change if the units of measurement on x and/or y are changed? |
r uses standardized values |
|
|
If you are 1.43 standard deviations taller than the mean when measured in inches, how many standard deviations above the mean will you be when measured in centimeters? |
1.43 |
|
|
The linear correlation coefficient is always between what two numbers? |
-1 and 1 |
|
|
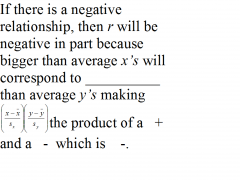
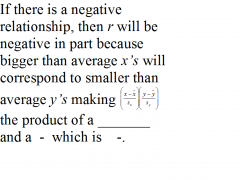
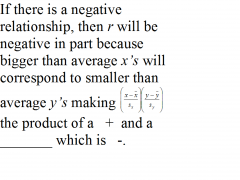
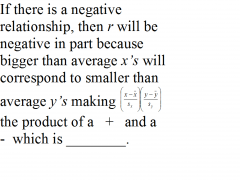
smaller |
|
|
+ |
|
|
- |
|
|
- |
|
|
Does r measure the strength of the relationship between x and y? |
no |
|
|
The only kind of relationship r measures is what? |
linear |
|
|
Name three other relationships besides linear. Such as exponential, quadratic & ________ |
logistic |
|
|
Name three other relationships besides linear. Such as exponential, logistic & ________ |
quadratic |
|
|
Name three other relationships besides linear. Such as logistic, quadratic, & ________ |
exponential |
|
|
Is r sensitive to outliers? |
yes |
|
|
Is theregression line sensitive to outliers? |
yes |
|
|
A change in one standard deviation of x results in a change of ____ standard deviations in y. |
r |
|
|
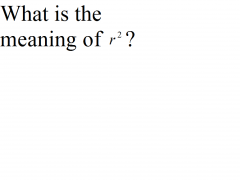
% of the difference in y explained by the regression line on x |
|
|
If a scatter plot does not show a linear pattern can you still find the line of best fit? |
yes |
|
|
If a scatter plot does not show a linear patternshould you still find the line of best fit? |
no |
|
|
If r is close to 1 or -1 is that enough of a reason to find the line of best fit? |
no |
|
|
Are predictions for y based on an x far beyond the range of x’s you have data for are reliable? |
no |
|
|
Predicting a y based on an x far beyond the range of x’s you have data for is called what? |
extrapolation |
|

Which scatter plot shows a stronger relationship? |
B |
|
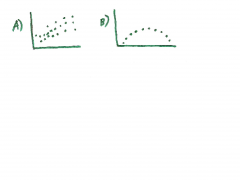
Which scatter plot will have a higher value of r? |
A |
|
|
If there is a strong correlation between x and y does that mean that changing x will most likely bring about a change in y? |
no |
|
|
Give an example in which there is a strong association between x and y, but there is no cause and effect. |
ice cream sales & sunburns |
|
|
There is a strong relationship between elementary kids’ grades and involvement in soccer, explain how this could be true even if there is no cause and effect. |
lurking variable – how much the parents want their kids to succeed |
|
|
Give an example in which there is a fairly strong linear correlation between x and y but there is another variable contributing to the differences in y besides x. Name the two variables. |
BMI between mothers and daughters, genetic and environmental |
|
|
People are often interested in how one variable affects another, give an example in which there are many variables involved and it is basically impossible to do so. |
Gun control laws & violent crime levels |
|
|
Do you think that people with an agenda will still try to show x affects y even if the setting is too complex with many variables interacting? |
yes |
|
|
What was a possible lurking variable that would explain why it appears that smoking causes lung cancer despite a high correlation between smoking and lung cancer? |
a gene that both made people addicted to nicotine and gave them lung tumors |
|
|
What is some really good evidence that there is not some gene that both causes lung cancer and nicotine addiction? |
the gene would have appeared coincidentally later in women who started smoking later than men |
|
|
There is a strong correlation between education and wealth. Give a possible lurking variable that could explain this without having education have a cause and effect on wealth. |
how motivated a person is |
|
|
If a person is motivated they are likely to become wealthy and also become educated. Do you think that motivation explains all the association between education and wealth, so in fact there is no cause and effect? |
no |
|
|
If a person is motivated they are likely to become wealthy and also educated. Do you think that motivation explains part of the association between education and wealth, so in fact the cause and effect still exists, but it not a strong as many might think? |
yes |
|
|
Give an example in which a lurking variable makes a cause and effect look weaker than it actually is. |
scatterplot of degree days and gas used to heat a house but half way through the collection of data solar panels were installed and reduced the gas bills |
|
|
Which scatter plot will have more scatter, or will they be about the same? A) SAT math vs SAT verbal for individual students, B) SAT math vs SAT verbal for state averages. |
A |
|
|
If you try to predict an individual student’s SAT verbal from their SAT math using the regression line for state averages instead of individuals will the prediction be too high, too low, or about right? about rightviduaDҚA |
about right |
|
|
If you try to predict an individual student’s SAT verbal from their SAT math using the regression line for state averages instead of individuals will the prediction be more reliable, less reliable, or have about the right amount of reliability? |
less reliable |
|
|
With categorical data a what takes the place of a scatter plot? |
two-way table |
|
|
What is Simpson’s Paradox? |
a relationship that holds in each subcategory but reverses when all the data is combined |
|
|
Give an example of Simpson’s Paradox. |
helicopters vs road for accident victims, helicopters do better in serious and less serious cases, but when combined the road did better |
|
|
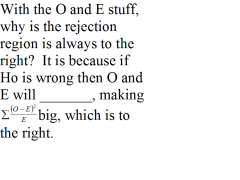
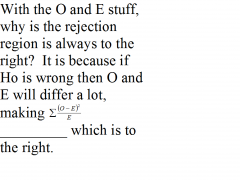
differ a lot |
|
|
big |
|
|
The E’s in the O and E stuff are found assuming what? |
Ho is true |
|
|
With the O and E stuff we want all the E’s to be at least what to get good results? |
10 |
|
|
The 4 assumptions for ANOVA are ________, equal variances, independent samples and SRS’s. |
normal populations |
|
|
The 4 assumptions for ANOVA are normal populations, __________, independent samples and SRS’s. |
equal variances |
|
|
The 4 assumptions for ANOVA are normal populations, equal variances, ____________ and SRS’s. |
independent samples |
|
|
The 4 assumptions for ANOVA are normal populations, equal variances, independent samples and _____. |
SRS's |
|
|
If you do a good job of collected data from different sources, the data will vary for only two reasons, those are _______ and luck. |
source |
|
|
If you do a good job of collected data from different sources, the data will vary for only two reasons, those are source and _______. |
luck |
|
|
In ANOVA to reject Ho: “all means equal” you hope the variance due to ________ is high and the variance due to error is low. |
factor |
|
|
In ANOVA to reject Ho: “all means equal” you hope the variance due to factor is high and the variance due to ____________ is low. |
error |
|
|
Variance due to factor is a weighted ____________ of the sample means. |
variance |
|
|
Variance due to factor is a weighted variance of the sample ___________. |
means |
|
|
Variance due to error is a weighted ____________ of the sample variances. |
mean |
|
|
Variance due to error is a weighted mean of the sample ____________. |
variances |
|
|
There are four things should you check in addition to graphing a scatter plot before calculating the least-squares line, those are that ______________ , the data are normally distributed about the line, the standard deviation is similar throughout the line, and the data is independent. |
data is linear |
|
|
There are four things should you check in addition to graphing a scatter plot before calculating the least-squares line, those are that the data are linear, ___________________________________, the standard deviation is similar throughout the line, and the data is independent. |
data is normally distributed about the line |
|
|
There are four things should you check in addition to graphing a scatter plot before calculating the least-squares line, those are that the data are linear, the data are normally distributed about the line, ________________________________, and the data is independent. |
standard deviation is the same throughout the line |
|
|
There are four things should you check in addition to graphing a scatter plot before calculating the least-squares line, those are that the data are linear, the data are normally distributed about the line, the standard deviation is similar throughout the line, and ________________________. |
independent data |