Reading...
![]()
Play button
![]()
Play button
![]()
Use LEFT and RIGHT arrow keys to navigate between flashcards;
Use UP and DOWN arrow keys to flip the card;
H to show hint;
A reads text to speech;
46 Cards in this Set
- Front
- Back
|
commodity
|
a good for which there is a demand, but which is supplied without qualitative differentiation across a market
+manufacturers turn to services to differentiate themselves and grow revenue |
|
|
operations management
|
the set of activities that relate to the creation of goods and services through the transformation of inputs to outputs
+planning for, organizing, and controlling production +decision areas=product design, quality mgmt, process and capacity planning, location strategies, layout strategies, job design, supply chain mgmt, inventory mgmt, scheduling, maintenance, and reliability |
|
|
production
|
the creation of goods and services through the transformation of inputs to outputs
|
|
|
productivity
|
ratio of outputs to inputs
+single factor-uses only one input +multifactor-uses multiple inputs |
|
|
service
|
"the application of specialized competencies through deeds, processes, and performances for the benefit of another entity or the entity itself"
+economic activities that typically produce an intangible product +infrastructure, financial, distribution, professional, personal, hospitality, entertainment, healthcare, education, maintenance/repair |
|
|
benchmarking
|
comparing own performance to another organization who is known to be best in class
|
|
|
continuous improvemen (kaizen)
|
the implementation of a large number of small incremental improvements over time
+ongoing process of unending improvement +the setting and achieving of ever-higher goals |
|
|
fail-safing (poka-yoke)
|
any mechanism that helps people avoid mistakes
+can't put diesel fuel nozzle into an unleaded fuel tank +beeping sound when car is turned off but keys are still in ignition |
|
|
gap analysis (card 1 of 2)
|
uses surveys to measure differences between customers' expected and perceived service
|
|
|
gap analysis (card 2 of 2)
+categories of perceptions commonly surveyed |
1-tangibles
(physical facilities and equipment; employee appearance) 2-reliability (ability to perform service) 3-responsiveness (willingness to help) 4-assurance (knowledge, competence, courtesy, and ability to inspire trust) 5-empathy (caring and understanding of customer situation) |
|
|
ISO 9000
|
a series of quality standards defined by the International Standard Organization, comprised of representatives of different member nations
+doesn't prescribe specific practices but focuses on the requirements for a quality management system +European Economic Community-requires ISO certification to do business in the European nations |
|
|
service recovery
|
empowering employees to immediately solve customer problems and/or give something of value
+when mistakes are made, it is possible to avoid losing customer goodwill |
|
|
statistical process control
|
involves taking measurements of some aspect of a service and comparing to performance standards
+uses control charts to distinguish natural and assignable sources of variation |
|
|
control chart
|
a graphical presentation of process data over timed
+used to distinguish between natural and assignable sources of variation |
|
|
natural variation
|
normal variation which cannot be eliminated in current process
+"common" +variability that affects every production process to some degree and is to be expected +the many sources of variation that occur within a process that is in statistical control |
|
|
assignable variation
|
attributable to some cause
+machine wear, misadjusted equipment, fatigued or untrained workers, new batches of raw materials |
|
|
process distribution
|
known only by measuring 100% of output relative to some measure with perfect accuracy
+usually too expensive so we use samples to estimate parameters of the processs distribution and evaluate its performance |
|
|
sample
|
some fraction of total output
|
|
|
competitive advantage (slide 1 of 2)
|
superiority on some competitive dimension(s) relative to industry rivals
|
|
|
operations frontier (slide 1 of 2)
|
defined by best-in-class firms at a given point in time
+not possible to be all things to all people +implication-use focused processes which optimize a limited set of performance objectives + |
|
|
positioning
|
the product space that a firm wants to occupy where space is measured along competitive dimensions of product attribute
+choosing the direction of improvement in the operations frontier |
|
|
strategic fit (slide 1 of 2)
|
the consistency between the competitive advantage the firm seeks and the design of processes used achieve that advantage
|
|
|
strategic fit (slide 2 of 2)
+how to achieve |
+market driven strategy-start with market positioning and competitive priorities and then design processes to support them
+process driven strategy-start with process competencies adn then identify market position best served by these competencies |
|
|
strategy
|
some have argued that building blocks of strategy are not markets and products but rather processes which attain are the core competencies and capabilities used to attain competitive advantage
|
|
|
corporate strategy
|
a unique position chosen to achieve competitive advantage and ensure long-term organizatinal success
|
|
|
process(operations) strategy
|
the choice of operations performance objectives and the design of processes (especially the arrangement of resources within processes) to achieve performance objectives
|
|
|
value added map
|
gives the customer something they want or need
+value stream mapping-a tool used to analyze and design the flow of materials and information required to provide value to a consumer +goal-to make the process "lean" by removing non-value added activities from the process |
|
|
Little's Law
|
in a stable process, there is a fundamental relationship between the averages of flow time(T), flow rate(R), and inventory(I)
+stable process-the average inflow rate is the same as the average outflow rate over the long run I=R x T |
|
|
inventory(I)
|
the number of units in the process
|
|
|
flow rate(R)
|
the number of units that flow through the process per unit of time
+"throughput rate" |
|
|
flow time(T)
|
the time spent by a unit in the process
|
|
|
flow unit
|
a patient, a car, an insurance claim, a customer order, a dollar, a project
|
|
|
strategy
|
units enter process as input, flow through various activities, and then exit as output
|
|
|
distinctive characteristics of services
|
1-customer participation-customer is an active player in the service
2-intangibility-services are performances and ideas 3-heterogeneity-delivered service varies from customer to customer 4-simultaneity-services are produiced and consumed at the same time 5-perishability-services are time perishable and cannot be inventoried for later use |
|
|
common dimensions of a service business (slide 1 of 2)
|
1-degree of customer contact and interaction
2-type of customer contact 3-degree of service customization and variety 4-degree of labor vs capital intensity 5-type of recipient |
|
|
common dimensions of a service business (slide 2 of 2)
|
6-type of relationship with customer
7-degree of employee discretion in meeting customer demands 8-degree of demand fluctuation over time 9-mode of delivery 10-number of service outlets |
|
|
single factor productivity
|
units produced/
input used |
|
|
multifactor productivity
|
output/
(labor+material+energy+capital+misc) |
|
|
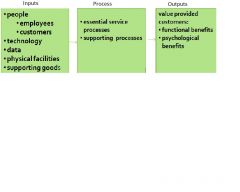
service operations model
|
|
|
|
total quality management (TQM)
|
a philosophy about managing quality that emphasizes:
+customer satisfaction +continuous improvement +employee involvement +management of an entire organizatin so that it excels in all aspects of products and services that are important to the customer |
|
|
quality
|
the ability of an offering to satisfy customer needs
+customer based view-the extent to which customer perceptions of an offering meet or exceed their expectations +provider based view-the extent to which the offering conforms to predefined standards |
|
|
costs of quality
|
1-prevention costs-costs of reducing the potential for quality problems
2-appraisal costs-costs of evaluating and detecting quality problems 3-internal failure costs-costs of fixing quality problems +guarantees, warranties, rework 4-external failure costs-cost of lost customer goodwill and negative word of mouth effects |
|
|
W. Edwards Deming
|
insisted that managemetn take responsibility for quality problems which result from poor organizational processes not low performing employees
+famous for his 14 points |
|
|
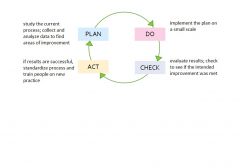
Deming's PDCA Cycle
|
|
|
|
continuous vs discrete measures
|
+continuous-between any two values, there are an infinite numer of other values (height, elapsed time, weight, distance)
+discrete-there are a finite or countable number of values(the legs on an animal, gender, whether or not a package is damaged) |
|
|
steps for creating control charts
|
1-collect samples from a stable process
2-compute control limits 3-graph the sample statistics 4-investigate any points that are outside of control limits 4a-if they have assignable causes, correct problem and go to step 1 5-use control limits to monitor process |