Reading...
![]()
Play button
![]()
Play button
![]()
Use LEFT and RIGHT arrow keys to navigate between flashcards;
Use UP and DOWN arrow keys to flip the card;
H to show hint;
A reads text to speech;
231 Cards in this Set
- Front
- Back
|
What is Evidence-based practice?
|
the use of the best clinical evidence in making patient care decisions
Both consumers and producers play a key role in EBP |
|
|
What is quantitative research?
|
The investigation of phenomena that lend themselves to precise measurement and quantification, often involving a rigorous and controlled design.
involves analysis of numerical data |
|
|
What is qualitative research?
|
The investigation of phenomena, typically in an in-depth and holistic fashion, through the collection of rich narrative materials using a flexible research design.
involves analysis of data such as words |
|
|
Which form of research deals with the experience of a life event?
|
qualitative
|
|
|
What are the 2 types of non-experiemental research?
|
-descriptive
-correlational |
|
|
What are the names of the 2 types of experimental research?
|
-True experimental (Randomized clinical trial)
-Quasi-experimental |
|
|
What type of research focuses on the lived experiences of humans?
|
phenomenological
|
|
|
WHat is grounded theory?
|
seeks to understand key social psychological processes
|
|
|
What is the qualitative research that focuses on the patterns and lifeways of a culture?
|
Ethnographic
|
|
|
what are concepts?
|
abstractions of particular aspects of human behavior or characteristic (pain, weight)
|
|
|
Describe constructs.
|
are slightly more complex abstractions (e.g., self-care).
|
|
|
Theories and __ __ knit conepts into a coherent system that purports to explain phenomena.
|
conceptual models
|
|
|
The Term “variable” is used almost exclusively in ___ research.
|
quantitiative
|
|
|
What is a variable
|
A characteristic or quality that takes on different values, i.e., that varies from one person to the next
|
|
|
what is the independent variable?
|
the presumed cause (of a dependent variable)
|
|
|
What is the dependent variable?
|
the presumed effect (of an independent variable)
|
|
|
what is often known as the outcome variable?
|
dependent variable
|
|
|
What are the types of variables?
|
-continuous
-categorical -independent -dependent |
|
|
What is conceptual definition?
|
: the abstract or theoretical meaning of a concept being studied
|
|
|
What is the operational definition of concepts and variables?
|
the operations (measurements) a researcher must perform to collect the desired information
|
|
|
What type of data is collected in quantitative research?
|
numeric
|
|
|
Which type of research collects verbal/narrative data?
|
qualitative
|
|
|
Which of the following best describes a dependent variable?
A. Outcome being measured B. A person’s gender C. Presumed cause D. Measurements performed |
A
|
|
|
What occurs in phase 1: the conceptual phase of the process?
|
-Formulating research problem and research question
-Reviewing related literature -Undertaking clinical fieldwork -Defining the framework and developing conceptual definitions -Formulating hypotheses |
|
|
What is Phase 2: the design and planning phase?
|
-Selecting a research design
-Identifying the population -Designing the sampling plan -Specifying methods to measure variables and collect data -Developing methods to protect human/animal rights -Finalizing the research plan -Conduct polit |
|
|
What is part of the empirical phase?
|
-Collecting the data
-Preparing data for analysis (e.g., coding the data) |
|
|
What type of data is collected in quantitative research?
|
numeric
|
|
|
What is in the analytic phase? Phase 4
|
- Analyzing the data
- Interpreting results |
|
|
Which type of research collects verbal/narrative data?
|
qualitative
|
|
|
What is phase 5: Dissemination phase?
|
-Communicating the findings in a research report (e.g., in a journal article)
-Utilizing findings in practice |
|
|
Which of the following best describes a dependent variable?
A. Outcome being measured B. A person’s gender C. Presumed cause D. Measurements performed |
A
|
|
|
What is the problem statement? What must it include?
|
-A statement articulating the research problem and making an argument to conduct a new study
-Broad enough to include central concerns -Narrow enough to serve as a guide to study design |
|
|
What occurs in phase 1: the conceptual phase of the process?
|
-Formulating research problem and research question
-Reviewing related literature -Undertaking clinical fieldwork -Defining the framework and developing conceptual definitions -Formulating hypotheses |
|
|
What are the components of a problem statement?
|
-Identification of the problem
-Background -Scope -Consequences -Knowledge gaps -Proposed solution |
|
|
What is Phase 2: the design and planning phase?
|
-Selecting a research design
-Identifying the population -Designing the sampling plan -Specifying methods to measure variables and collect data -Developing methods to protect human/animal rights -Finalizing the research plan -Conduct polit |
|
|
What is part of the empirical phase?
|
-Collecting the data
-Preparing data for analysis (e.g., coding the data) |
|
|
What is in the analytic phase? Phase 4
|
- Analyzing the data
- Interpreting results |
|
|
What is phase 5: Dissemination phase?
|
-Communicating the findings in a research report (e.g., in a journal article)
-Utilizing findings in practice |
|
|
What is the problem statement? What must it include?
|
-A statement articulating the research problem and making an argument to conduct a new study
-Broad enough to include central concerns -Narrow enough to serve as a guide to study design |
|
|
What are the components of a problem statement?
|
-Identification of the problem
-Background -Scope -Consequences -Knowledge gaps -Proposed solution |
|
|
What is the statement of purpose?
|
The researcher’s summary of the overall study goal
|
|
|
List the aspects of the statement of purpose for quantitative research.
|
-Identifies key study variables
-Identifies possible relationships among variables -Indicates the population of interest -Suggests, through use of verbs, the nature of the inquiry (e.g., to test…, to compare…, to examine…) |
|
|
List the aspects of the statement of purpose for qualitative studies
|
-Identifies the central phenomenon
-Suggests the research tradition (e.g., grounded theory, ethnography) -Indicates the group, community, or setting of interest -Suggests, through use of verbs, the nature of the inquiry (e.g., to describe…, to discover…, to explore…) |
|
|
What are the aspects of the hypothesis?
|
-States an expectation, a predicted answer to the research question
-Should almost always involve two or more variables -Suggests the predicted relationship between the independent variable and the dependent variable -Must contain terms that indicate a relationship (e.g., more than, different from, associated with) -Is articulated almost exclusively in quantitative (not qualitative) studies -Is tested through statistical procedures -Always use present tense. |
|
|
What is a simple hypothesis?
|
Expresses a predicted relationship between one independent variable and one dependent variable
|
|
|
What are complex hypotheses?
|
States a predicted relationship between two or more independent variables and/or two or more dependent variables
|
|
|
Describe directional hypotheses?
|
-Predicts the direction of a relationship
-e.g. Hospitals with better nurse staffing have less patient falls than hospitals with poor nurse staffing |
|
|
What do nondirectional hypotheses predict?
|
Predicts the existence of a relationship, not its direction
|
|
|
What is the statistical or null hypothesis?
|
Expresses the absence of a relationship (used only in statistical testing)
|
|
|
T or F: hypotheses are proved or disproved through research?
|
FALSE
|
|
|
Statistical hypothesis testing (can/cannot) provide absolute proof?
|
cannnot
|
|
|
Experimental design requires researcher to actively ____ at least one variable which is considered the ___.
|
manipulate; intervention
|
|
|
When is data collected in a cross-sectional design?
|
at a single point in time
|
|
|
True or false: there is a manipulation of variables in an observational study?
|
false
|
|
|
In a non-experimental they ___ a phenomena or examines the relationships between variables?
|
observe
|
|
|
what is a longitudinal design?
|
data are collected two or more times over an extended period
|
|
|
In terms of outcome and causes, what is the direction of a retrospective design?
|
outcome --> cause
|
|
|
a design that goes from causes --> outcomes is a ____
|
prospective design
|
|
|
What is the criteria to establish causality in an experimental design?
|
-temporal
-empirical relationship -relationship cannot be explained by a third variable |
|
|
What are the aspects of a true experimental design?
|
RCT
-control group and randomization |
|
|
What determines a quasi-experimental design?
|
Lack of at least one of the two properties: randomization or a control group
|
|
|
Both true experimental and quasi involve ___ of an independent variable.
|
manipulation
|
|
|
What is intervention?
|
Process of maneuvering the independent variable so that its effect on the dependent variable can be observed
|
|
|
What are the types of interventions that are done with the control group?
|
-No intervention at all
-A placebo intervention -A usual care intervention -A different intervention -Same intervention but of different “dose” |
|
|
EWhat is randomization?
|
Each participant has an equal & known chance of being assigned to either the control or experimental group
|
|
|
What are the ways of randomization?
|
-Tossing coin
-Random numbers table -Computerized random number generators |
|
|
What are the strengths of a RCT?
|
-Groups are comparable
-Control confounding -Systematic variance (between group variance) = effect of intervention + confounding |
|
|
What is the Most reliable type of scientific evidence in the hierarchy of evidence?
|
RCT
|
|
|
What are the weakness to RCT?
|
-Practical
-Time, cost, ethical concern -Adherence -Sample is not representative, threat to external validity |
|
|
What is the name of the RCT that is the most rigorous design that controls for the effect of the pretest?
|
Solomon four-group design
|
|
|
How many variables are manipulated in a factorial design?
|
2 or more simultaneously
|
|
|
If a research tests both main effects and interaction effects with randomized block design, what type of RCT design is it?
|
Factorial design
|
|
|
What are the aspect of a crossover design?
|
-Subjects exposed to more than one interventions, in different orders
-Repeated measures -Subjects serving as their own control group -Carryover effects |
|
|
What are the aspects of a quasi-experimental design?
|
-Do not have equivalence by randomization, or
-Do not have control group |
|
|
The lack of rigorous control in a quasi-exp threatens the ___ ___.
|
internal validity
|
|
|
What are the weaknesses of the quasi?
|
Lack of control of confounding
|
|
|
What are the strengths of the quasi?
|
-Practical, feasible, relevant to “real nursing world”
-Enhance generalizability – external validity |
|
|
What is the purpose of an descriptive study design?
|
To observe, describe or document some aspect of a naturally occurring situation
|
|
|
What is the purpose of the correlational study design?
|
To understand relationships among phenomena as they naturally occur, without any researcher intervention
>=2 variables |
|
|
What type of design usually describes the incidence, prevalence, or particular characteristics present in a population.
Usually no theoretical framework and No hypothesis |
Descriptive study design
|
|
|
What type of control is over a descriptive study design?
|
Uncontrolled
-No treatment or intervention |
|
|
What are the factors of a correlational design?
|
-No control or manipulation of the situation
-Variables and can be detected through statistical analysis -Can look at relationship between 2 variables, or >= 2 variables -Data can be Cross-sectional or Longitudinal |
|
|
True or false: correlations can prove causation.
|
False: does not prove causation
|
|
|
What are the 2 types of epidemiologic designs?
|
1. case-control design
2. cohort design |
|
|
What is a case control design?
|
retrospective design.
Typically examines multiple exposures in relation to a disease; subjects are defined as cases and controls, and exposure histories are compared. |
|
|
WHich epidemiologic design is a prospective design?
|
cohort
|
|
|
What is a cohort study?
|
Typically examines multiple health effects of an exposure; subjects are defined according to their exposure levels and followed for disease occurrence.
|
|
|
What is the equation for risk?
|
Risk = # in group who had outcome/ Total # in group
a/a+b |
|
|
What is the relative risk equation?
|
Risk of group A/ Risk of group B
(a/(a+b)) / (c/(c+d)) |
|
|
What is the interpretation of relative risk?
|
1 = same risk
<1 = Group A has less risk >1 = Group A has more risk |
|
|
What is the odds equations?
|
(# in group who had outcome) / (# in group who did not have outcome)
|
|
|
What is the equation for odds ratio?
|
Odds of group A/ Odds of group B
(a/b) / (c/d) |
|
|
What are the interpretations of the odds ratio?
|
1 = Same odds of having outcome
<1 = Group A has lower occurrence of outcome than group B has >1 = Group A has more occurrence of outcome than group B has |
|
|
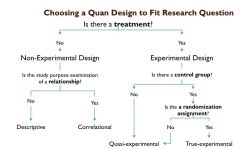
What is the flow chart for choosing a quantitative design of the research question?
|
|
|
|
what is a theory?
|
an abstraction that purports to account for or explain phenomena
|
|
|
What are the types of theories?
|
-Grand
-middle range theories |
|
|
what are grand theories?
|
– a theory that attempts to explain large aspects of human experiences
|
|
|
What is a middle-range theory?
|
– a theory that focuses on a specific aspect of human experience
|
|
|
What are the characteristics of conceptual models?
|
-Deal with abstractions, assembled in a coherent scheme
-Represent a less formal attempt to explain phenomena than theories -Do not have formal propositions about relationships among phenomena |
|
|
What are the 4 concepts central to models of nursing?
|
-Human beings
-Environment -Health -Nursing |
|
|
what are the examples of key constructs from shared theories?
|
-Self-efficacy (Social Cognitive Theory)
-Stages of change (Transtheoretical Model) -Behavioral intentions (Theory of Planned Behavior) |
|
|
what are the theories of qualitative research?
|
-substantive theory
-grounded theory -ethnography -phenomenology |
|
|
What is a population?
|
The aggregate of cases in which a researcher is interested
|
|
|
what is the target population?
|
The entire population of interest
|
|
|
what is the accessible population
|
The portion of the target population that is accessible to the researcher,
from which a sample is drawn |
|
|
What is a strata and what does it do?
|
Subpopulations of a population (e.g.,
male/female) Often used to enhance the sample’s representative |
|
|
What is sampling?
|
Selection of a portion of the population (a sample)
to represent the entire population |
|
|
the sampling goal in quantitative studies is to have a __ __?
|
representative sample
|
|
|
what is a representative sample?
|
A sample whose key characteristics closely
approximate those of the population |
|
|
What are the ways to easily achieve a representative sample?
|
Probability sampling
Homogeneous populations Larger samples |
|
|
What is sampling bias?
|
The systematic over- or under-representation of segments of the population on key variables when the sample is not representative
|
|
|
Define sampling error.
|
Differences between sample values and population values
|
|
|
what is probability sampling?
|
Involves random selection of elements: each element has an equal, independent chance of being selected
|
|
|
Which type of sampling Does not involve selection of elements at random?
|
nonprobability sampling
|
|
|
List the types of probability sampling.
|
Simple random sampling – most basic probability sampling
Stratified random sampling Cluster (multistage) sampling Systematic sampling |
|
|
Describe simple random sampling.
|
Uses a sampling frame – a list of all population elements
assigns every element a unique number from 1 to N (where N =population size) Then draws n random numbers (with or without replacement) between 1 and N, where n =desired sample size |
|
|
why is simple random sampling cumbersome?
|
rarely possible to get a complete listing of population elements, not used in large, national surveys
|
|
|
Describe systematic sampling?
|
Selection of every kth case from a list Sampling interval – standard distance
between the selected elements Population size/sample size Identical to simple random sampling, but more convenient |
|
|
What is stratified random sampling?
|
Population is first divided into strata, then random selection is done from the stratified sampling frames
Enhances representativeness May be impossible if the strata information is not available |
|
|
What are the characteristics of cluster (multistage) sampling?
|
Successive random sampling of units from larger to smaller units (e.g., states, then zip codes, then households)
Widely used in national surveys Larger sampling error than in simple random sampling, but more efficient |
|
|
What are the types of non-prob sampling in quantitative research?
|
Convenience sampling Snowball (network) sampling Quota sampling Purposive sampling
|
|
|
What is convenience sampling?
|
Use of the most conveniently available people
Most widely used approach by quantitative researchers Most vulnerable to sampling biases |
|
|
Describe snowball sampling.
|
Referrals from other people already in a sample
Network sampling / chain sampling Used to identify people with distinctive characteristics, hard to identify Used by both quantitative and qualitative researchers |
|
|
What is quota sampling?
|
Convenience sampling within specified strata of the population
Enhances representativeness of sample Infrequently used, despite being a fairly easy method of enhancing representativeness |
|
|
what is consecutive sampling?
|
Involves taking all of the people from an accessible population who meet the eligibility criteria over a specific time interval, or for a specified sample size
A strong nonprobability approach for “rolling enrollment” type accessible populations Risk of bias low unless there are seasonal or temporal fluctuations |
|
|
Describe purposive (judgement) sampling.
|
Sample members are hand-picked by researcher to achieve certain goals
Used more often by qualitative than quantitative researchers Can be used in quantitative studies to select experts or to achieve other goals |
|
|
what is sample size?
|
adequacy is a key determinant of sample quality in quantitative research.
|
|
|
How is sample size determined?
|
power analysis
|
|
|
As sample size increases, probability of getting a representative sample ___.
|
increases
|
|
|
Sample size is effected by...
|
Effect size / group difference Significance level
Power |
|
|
what are the major types of data collection methods?
|
Self-reports
Observation Biophysiologic measures |
|
|
What are the instruments used for data collection in structure self-reports?
|
-interview schedule
-questionnaire |
|
|
What are the types of questions in a structured instrument?
|
Closed-ended (fixed alternative) questions
e.g., “Within the past 6 months, were you ever a member of a fitness center or gym?” (yes/no) Open-ended questions e.g., “Why did you decide to join a fitness center or gym?” |
|
|
List the specific types of closed ended questions.
|
Dichotomous questions Multiple-choice questions Forced-choice questions Rating question
|
|
|
What are the advantages of questionnaires?
|
Lower costs
Possibility of anonymity, greater privacy Lack of interviewer bias |
|
|
List the advantages of interviews.
|
Higher response rates
Appropriate for more diverse audiences Opportunities to clarify questions or to determine comprehension Opportunity to collect supplementary data through observation |
|
|
What are scales used for? give an example.
|
used to make fine quantitative discriminations among people with different attitudes, perceptions, traits
Likert scales—summated rating scales |
|
|
what are the linkert scales?
|
Consist of several declarative statements (items) expressing viewpoints
Responses are on an agree/disagree continuum (usually 5 or 7 response options). Responses to items are summed to compute a total scale score |
|
|
List the types of response set biases.
|
Social desirability response set bias
Extreme response set Acquiescence response set (yea- sayers) |
|
|
What are the types of observation?
|
Hidden vs. open
Eliminate social desirability Problems with informed consent, public behavior |
|
|
what are the sources of bias with observation?
|
Subject
Observer Fatigue |
|
|
what are the advantages to biophysical measurements?
|
Objectivity
Precision |
|
|
What are the disadvantages to biophysical measurement?
|
Still have measurement error
Discomfort, risk Expense |
|
|
What are the advantages to proper measurement?
|
Removes guesswork
Provides precise information Less vague than words |
|
|
List the 4 levels(classes) of measurement.
|
Nominal
Ordinal Interval Ratio |
|
|
Describe nominal scales
|
Used when data can be organized in to categories of a defined property, but the categories cannot be ordered.
Categories must be mutually exclusive, and all data must fit into the established categories |
|
|
describe ordinal scales
|
Used when data can be assigned to categories that can be ranked
Categories must be mutually exclusive, and all data must fit into the established categories Intervals between ranked categories cannot be assumed to be equal |
|
|
What are the characteristics of interval scales? give an example
|
Distances between intervals of the scale are numerically equal
Like ordinal scales have mutually exclusive categories, exhaustive categories and rank ordering Values are presumed to lie on a continuum, and change can be precisely measured Absolute amount of an attribute cannot be precisely measured since no zero point on scale Blood Pressure |
|
|
what are ratio level scales and give an example?
|
Also have mutually exclusive categories, exhaustive categories, rank ordering, equal spacing between intervals, and a continuum of values
Have an absolute zero point. Addition of a zero point not only allows you to document the absence of some quality, it also allows you to say that something weighs twice as much as another object Number of hours worked / Number of hours sleep |
|
|
what is an evaluation of the quality of a measuring instrument?
|
psychometric assessment
|
|
|
what are the key criteria is psychometric assessment>?
|
Reliability
Validity |
|
|
reliability is The ___ and ___ with which an instrument measures the target attribute
|
consistency; accuracy
|
|
|
reliability coefficients below __ are considered unsatisfactory?
|
0.7
|
|
|
what 3 aspect of reliability can be evaluated?
|
Stability
Internal consistency Equivalence |
|
|
What is stability and how is it evaluated?
|
The extent to which scores are similar on two separate administrations of an instrument
Evaluated by test–retest reliability Requires participants to complete the same instrument on two occasions Appropriate for relatively enduring attributes (e.g., creativity) |
|
|
Describe the characteristics of internal consistency.
|
The extent to which all the items on an instrument are measuring the same unitary attribute
Evaluated by administering instrument on one occasion Appropriate for most multi-item instruments The most widely used approach to assessing reliability Assessed by computing coefficient alpha (Cronbach’s alpha) Alphas ≥.80 are highly desirable. |
|
|
What is equivalence?
|
The degree of similarity between alternative forms of an instrument or between multiple raters/observers using an instrument
Most relevant for structured observations Assessed by comparing agreement between observations or ratings of two or more observers (interobserver/interrater reliability) |
|
|
what are the 4 reliability principles?
|
Low reliability can undermine adequate testing of hypotheses.
Reliability estimates vary depending on procedure used to obtain them. Reliability is lower in homogeneous than heterogeneous samples. Reliability is lower in shorter than longer multi-item scales. |
|
|
What is validity?
|
The degree to which an instrument measures what it is supposed to measure
|
|
|
List the 4 aspects of validity.
|
Face validity
Content validity Criterion-related validity Construct validity |
|
|
what type of validity
Refers to whether the instrument looks as though it is an appropriate measure of the construct Based on judgment; no objective criteria for assessment |
Face validity
|
|
|
which form of validity is evaluated by content validity index?
|
construct validity
|
|
|
The criterion-related validity is measured by the ___ ___.
|
validity coefficient
|
|
|
what is the validity coefficient?
|
is calculated by analyzing the relationship between scores on the instrument and the criterion.
|
|
|
What are the 2 types of criterion-related validity?
|
Predictive validity: the instrument’s ability to distinguish people whose performance differs on a future criterion
Concurrent validity: the instrument’s ability to distinguish individuals who differ on a present criterion |
|
|
What are the 2 questions that concern construct validity?
|
Concerned with these questions: What is this instrument really
measuring? Does it adequately measure the construct of interest? |
|
|
What are the methods for assessing construct validity?
|
Known-groups technique Testing relationships based on theoretical
predictions Factor analysis |
|
|
What is sensitivity?
|
Sensitivity: the instruments’ ability to correctly identify a “case”—i.e., to diagnose a condition
|
|
|
define specificity
|
Specificity: the instrument’s ability to correctly identify noncases, that is, to screen out those without the condition
|
|
|
Describe the likelihood ratio.
|
Summarizes the relationship between sensitivity and specificity in a single number
LR+: the ratio of true positives to false positives LR-: the ratio of false negatives to true negatives In a test with high on both sensitivity & specificity, the LR+ is high, and LR- is low. |
|
|
What is a frequency distribution?
|
A systematic arrangement of numeric values on a variable from lowest to highest, and a count of the number of times (and/or percentage) each value was obtained
|
|
|
How can frequency distributions be described?
|
◦ Shape
◦ Central tendency ◦ Variability |
|
|
What direction is the tail of a positive skew? give an example.
|
The tail points to the right. Worldwide income
|
|
|
Which type of of distribution has a long tail that points to the left?
|
Negative skew: age of death
|
|
|
What is meant by the modality of a distribution?
|
the number of peaks
|
|
|
What are the characteristics of normal distribution?
|
-Symmetric
-unimodal -not too peaked, not too flat -mean = median = mode |
|
|
What is the mean?
|
equals the sum of all scores divided by the total number of scores
◦ Ex:2,3,3,3,4,5,6,7,8,9 Mean = 5.0 |
|
|
What is the mode?
|
the most frequently occurring score in a distribution
◦ Ex:2,3,3,3,4,5,6,7,8,9 Mode = 3 |
|
|
What is the median?
|
the point in a distribution above which and
below which 50% of cases fall ◦ Ex:2,3,3,3,4 | 5,6,7,8,9 Median = 4.5 |
|
|
What is the most stable and widely indicator of central tendency?
|
the mean
|
|
|
The __ is useful mainly as a descriptor of typical value when distribution is skewed (eg household income)
|
median
|
|
|
The __ is useful mainly as gross descriptor, especially of nominal measures
|
mode
|
|
|
If a distribution is considered as homogeneity the it has ___ variability.
|
little
|
|
|
what is the name of distribution that has great variability?
|
heterogeneity
|
|
|
what is the range?
|
highest value minus lowest value
|
|
|
the mean +/- 1 SD = middle ___ distribution.
|
68%
|
|
|
how many SDs is equal to the middle 95%
|
2SD
|
|
|
If the value is in the 3rd SD what % is the distribution.
|
99.7%
|
|
|
What is the variance?
|
standard deviation, squared
|
|
|
What are the 2 common approaches to bivariate descriptive statistics?
|
◦ Contingency tables (Crosstabs) ◦ Correlation coefficients
|
|
|
What type of variables are used in contingency tables?
|
nominal or ordinal
|
|
|
what is a contingency table?
|
A two-dimensional frequency distribution; frequencies of two variables are cross-tabulated
|
|
|
What are correlation coefficients?
|
indicate direction and magnitude of relationship between 2 variables.
|
|
|
What is the most widely used correlation coefficient?
|
Pearson's r
|
|
|
When is pearson's r used?
|
when both variables are interval or ration-level measures
|
|
|
what is the range of correlation coefficients
|
-1 to +1
|
|
|
What is a negative relationship of a correlation coefficient?
|
one variable increases in value as the other decreases
eg: amount of exercise and weight |
|
|
Give an example of positive relationship?
|
eg: calorie consumption and weight
|
|
|
What is the strength of the correlation coefficient?
|
the absolute value of the coefficient
ex: r = -.45 is stronger than r = +.40 |
|
|
What is a point estimation?
|
A single descriptive statistic that estimates the population value (e.g., a mean, percentage, or OR)
|
|
|
What is an interval estimation?
|
A range of values within which a population value probably lies
◦ Involves computing a confidence interval (CI) |
|
|
What are confidence intervals?
|
CIs indicate the upper and lower confidence limits and the probability that the population value is between those limits.
|
|
|
What is the level of significance (alpha) tell?
|
the probability of incorrectly injecting the null hypothesis (making type I error)
◦ Usually set up as 0.05 |
|
|
How do you know that the result is statistically significant?
|
If the value of the test statistic indicates that the null hypothesis is improbable (p < 0.05),
|
|
|
What is meant by a nonsignificant result in hypothesis testing?
|
means that any observed difference or relationship could have happened by chance.
|
|
|
T or F: statistical significances are the same as clinical significances.
|
FALSE
|
|
|
what is a Type I error?
|
rejection of a null hypothesis when it should not be rejected; a false-positive result
|
|
|
The risk of error for a type I error is controlled by the ____.
|
level of significance (alpha)
|
|
|
What is a type II error?
|
failure to reject a null hypothesis when it should be rejected; a false-negative result
|
|
|
What is the risk of type II error measured by?
|
beta
|
|
|
What is power?
|
is the ability of a test to detect true
relationships; power = 1 – β. ◦ By convention, power should be at least .80. ◦ Larger samples = greater power |