![]()
![]()
![]()
Use LEFT and RIGHT arrow keys to navigate between flashcards;
Use UP and DOWN arrow keys to flip the card;
H to show hint;
A reads text to speech;
19 Cards in this Set
- Front
- Back
- 3rd side (hint)
|
What is the Arrhenius equation |
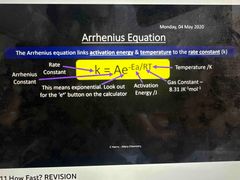
Linking activation energy and temperature to the rate constant Can be used to calculate activation energy or rate constant |
|
|
|
What does gradient of vol-time graph show |
Rate of reaction |
|
|
|
What is a clock reaction and it’s assumptions |
Reaction to time how long it takes for a reaction to occur - temperature of reaction is constant - conc of reactants doesn’t change significantly - reaction doesn’t go beyond end point Rate of clock reaction is assumed to be equal to initial reaction |
|
|
|
Iodine clock experiment |
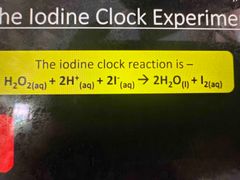
Add sodium thiosulfate and starch to excess H2O2 Sodium thiosulfate reacts with iodine produced in the reaction When sodium thiosulfate runs out, iodine reacts with starch to give black colour |
|
|
|
Rate equation |
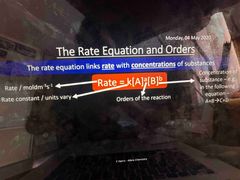
A and B only reactants |
|
|
|
What is zero order |
Changes in concentration has no effect on rate - if [A] doubles, rate doesn’t change |
|
|
|
What is order of reaction |
Power to which a concentration is raised to in the rate equation Tells us how concentration of substance affects the rate Can only be determined by practical experiments |
|
|
|
What is second order |
Changes in concentration has a squared proportional change on rate If [A] doubles, rate quadruples |
|
|
|
What is rate constant k |
Number that allows us to equate rate and concentration Increasing temp, increases k due to more kinetic energy Larger k means faster rate of reaction, but concentration of substances constant |
|
|
|
What does rate-concentration graph show |
Help to identify the order Create these graphs with known values of rates |
|
|
|
What does Concentration time graph |
Work out rate using the gradient Results from practical used to plot the graph |
|
|
|
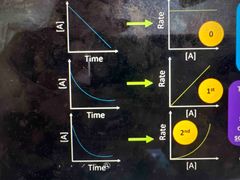
Rate graphs for first second and third order shapes |
|
Conc goes down Rate goes up |
|
|
What is half life and what does it show |
Time it takes half of the reactant to be used up Can be used to calculate rate constant Half life represented by t1/2 Units: s-1 |
|
|
|
Half life of first order |
Each half life same length K= ln2/t1/2 |
|
|
|
Initial rate method to investigate rate of reaction |
- repeat experiment several times, but changing the concentration of each reactant - work out initial rate of reaction by plotting graph conc time graph and working out gradient at 0 - record rate and conc to plot a graph - work out order - work out rate using equation |
|
|
|
What is rate determining step |
The slowest step in a multi step reaction Determines rate of whole step |
|
|
|
How to increase rate of reaction |
Use a catalyst or change temp to speed |
|
|
|
Working out rate equation with multi step reactions |
Back (Definition) |
|
|
|
What is the Arrhenius equation |
Linking activation energy and temperature to the rate constant Can be used to calculate activation energy or rate constant |
|