![]()
![]()
![]()
Use LEFT and RIGHT arrow keys to navigate between flashcards;
Use UP and DOWN arrow keys to flip the card;
H to show hint;
A reads text to speech;
139 Cards in this Set
- Front
- Back
- 3rd side (hint)
|
What does M (Italicised) stand for? A) Mode B) Mean |
B) Mean |
Test |
|
|
What is a Mean? A) Middle score B) Most common score C) Average of the sum of all score |
C) Average of the sum of all score |
Done |
|
|
What does X (italicised) stand for? a) Extreme score b) SD C) Individual score |
C) Individual score |
Dont |
|
|
What does SD stand for and what is it? |
Standard Deviation which means a quantity expressing by how much the members of a group differ from the mean value |
|
|
|
What does SE mean? |
Standard Error. a measure of the statistical accuracy of an estimate, equal to the standard deviation distribution of a large population of such estimates |
|
|
|
What is SS and what does it mean? |
Sums of squares. Sum of the square variation where variation is defined as the spread between each individual value and the mean. To determine the sum of squares, the distance between each data point and the line of best fit is Squared and then summed. |
|
|
|
What is N (italicised) and what is n? What is a Sample/ sampling error? |
N is the total sample size, n is the group size. A sample is a subset of a population. Sample value iscalled a statistic. A sampling error is discrepancybetween the population parameter and sample statistic |
|
|
|
What is a DV & What is an IV? how are they different? |
A DV is a dependent Variable and an IV is an independent variable. A DV is used to measure the predicted outcome whilst an IV is what is manipulated in the experiment to alter the DV. |
|
|
|
What are levels? what is k? |
Levels are the number of treatments for an IV for example: Temperature of an exam room being manipulated. k= is the number of treatments |
|
|
|
What is DF? Why is this important? |
Degrees of freedom, the amount in which a score is free to vary. |
|
|
|
What is a constant in statistics? |
A variable which remains the same for all individuals in your data set (status as a student) |
|
|
|
What is a confounding Variable? |
An unforeseen variable which effects the DV and varys systematically with the IV (for example increased drinking correlates with increased smoking= lung cancer. Could appear that increased drinking cause cancer if smoking was unaccounted) |
|
|
|
What is a test re-test? |
Adminstering test twice |
|
|
|
What is inter-rater reliability? |
extent to which two or more raters obtain the same result using the same measure |
|
|
|
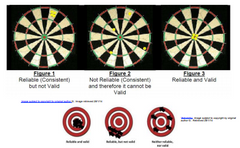
What is Spilt-half relability |
a test is spilt in two and the score for each half of the test is consistent. If the test is consisten it leads the experimenter to believe that it is most likely measuring the same thing |
|
|
|
What is Face Validity? |
Exam items on a test allow for you to determine what is being tested |
|
|
|
What is Content Validity? |
Adequate representation of all things being tested |
|
|
|
What is Construct Validity? |
Convergent- does the test correlate with the other test that assesses the same trait |
|
|
|
What is Divergent Validity? |
Test does not correlate strongly with test of different but related construct? |
|
|
|
Name the four types of measurement? |
Nominal, interval, ratio, ordinal |
|
|
|
What is Nominal data? |
Nominal (catergorical) is a type of data with categories which have no real order or measurement between them (religious groups) |
|
|
|
What is Ordinal data? |
Ordinal data is catergories which have a clear sequence but no clear measurement between them (army rankings) |
|
|
|
What is Interval data? |
Interval Data has meaningful differences between them but no true zero (temp) |
|
|
|
What is Ratio data? |
Ratio data has meaningful differences between them and a true zero |
|
|
|
Name 3 Test types |
Self report, Physiological, Behavioural |
|
|
|
What is Self report and what are its Negatives/ positives? |
Self report- survey based questionnaires. +ve Cheap, easy to find participants -ve Fake Bad, Fake Good. |
|
|
|
What is Physiological testing and what are its negatives and positives? |
Testing physiological responses (Such as hr/GSR) +ve: cannot be faked -ve: expensive, must be in a lab, requires expertises |
|
|
|
What is a behavioural test? |
Testing someones behaviour after manipulation such as the BOBO doll challenge +ve Rater is in control -ve time consuming, rater error and situational factors |
|
|
|
What are the 3 R of research ethics? |
Replacement, reduction, refinement |
|
|
|
Name 5 aspects of research ethics |
Informed consent, voluntary participants, Disclosure, ability to withdraw, ethics approval |
|
|
|
What is passive deception vs active deception? |
Passive deception is the use of a placebo. Active deception is confederates or false feedback. |
|
|
|
What is Psychology? |
The scientific study of behaviour and mental process |
|
|
|
What are the steps of scientific method? (5) |
Observe Theory Hypothesis Systematic (structured and planned obs) Evaluation (does it support the hypothesis) |
|
|
|
Name 5 types: |
Tenacity method (habit) Intuition method (Feels right) Authority method (Government) Rational method (if A>B than B>C) Empirical method (I saw it with my own eyes) |
|
|
|
Are Hypothesis & theory different? |
Yes. Hypothesis is a services of theories which are related. Hypothesis: A tenative statement or prediction. Theory: model that descirbes certain phenomenon work. |
|
|
|
What is the Research process? (10 steps) |
Idea, hypothesis, define concepts measurement, participants, research strategy (experimental), research design, run, analysis, write report, refine theory |
|
|
|
What make a good hypothesis? (3) |
Flasifiability correspondence with reality coherence and parsimony (occam's razor) |
|
|
|
What is an Extraneous variable? |
Control for these to prevent confounding variable (use past research to identify) |
|
|
|
What is Holding Constant? |
Keeping experiment to: - Same time -Same place -Same rater |
|
|
|
Name Two types of Group assignment: |
- Match across groups - randomisation |
|
|
|
What is the difference between between subject design and within subjects design? |
Between subjects (each group receives different manipulations). +ve no fatigue effects -Ve: individual differences Within groups (participants do one test, then manipulation, then another test). - less confounding variables - practice fatigue and drop out (Counterbalancing can help (changing test order) |
|
|
|
What are common issues with experimental participants? |
Differential attrition: drop out rate Diffusion: Participants talking |
|
|
|
What is parameters? |
Population values |
|
|
|
What is a Data, Datum, and Data Set? |
Data: Many score Datum: one score Data set: Collection of scores usually on many different variables |
|
|
|
What is the difference between an experimental manipulation and control manipulation? |
Experimental: manipulating IV Control: Active placebo vs passive placebo |
|
|
|
What is a Discrete variable? |
Measurements can only take on integer values |
|
|
|
What is an exaggerate variable? |
Use of extreme differences (expert help vs no help) |
|
|
|
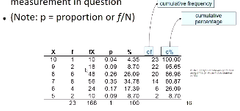
What is a frequency distribution table? |
Show the number of individuals with a certain value on the measurement in question (EXAM) |
|
|
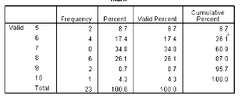
Interrupt the below table: |
What is the score for 5 |
|
|
|
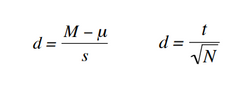
What is this Formula for? |
Mean |
|
|
|
Name the 3 types of distribution: |
Bell Curve (normal) Negative (more low scores) Positive (more high scores) |
|
|
|
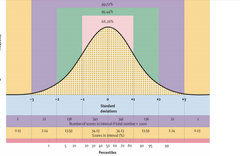
Name the 3 stats for SD of a normal bell curve: |
- 68% 1 SD - 95% 2 SD - 99% 3 SD |
|
|
|
What is a Z score? |
Z score transform raw scores into comparable data |
|
|
|
How does a Z score work? |
Changes all distributions to have a mean of 0 and SD of 1 . Distribution shape does not change |
|
|
|
What is Heuritics? |
Mental shortcuts of rules of thumb |
|
|
|
What is the availability heuristic? |
We estimate the likelihood of an occurrence based on the ease at which it comes to mind |
|
|
|
What is the representative Heuristic? |
Judge the probability of an event by similarity to a prototype or stereotype |
|
|
|
How to test a hypothesis? (5) |
Research hypothesis, null hypothesis, statistical sign, select and compute stat test, review hypothesis |
|
|
|
What is inferential statistics? |
Go beyond description of data, use to interpret data and draw conclusions |
|
|
|
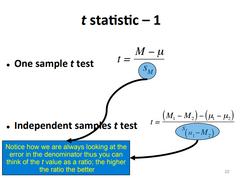
EXAM: What is a T test? |
The actual difference between a sample mean and the population mean/ estimate of standard error; that is, an estimate of the standard distance between a sample mean and population mean |
|
|
|
T-test probability looks at? |
Compares t obtained value with a T critical value to find the p value associate with the original t value |
|
|
|
What is a T-test DF? |
N-1 |
|
|
|
Interpret this table: What does this mean? |

|
|
|
|
What are the assumptions of a t-test? |
- Independence - population distribution if normal (parametric test- sig or not sig not effect size) |
|
|
|
Who do we determine a t-test effect size? |
Cohen's D.- shows how much the two populations do not overlap |
|
|
|
What is a Cohens D effect size? (3) |
Small= 0 Medium= 0.2 Large= d>0.8 |
|
|
|
What is the difference between an Independent t-test and two sample t-test? |
Independent t-test= Sample mean to pop mean. Two sample t-test= two sample means compared (boys vs girls or Before alcohol after alcohol) |
|
|

|
|
|
|
|
How do you use a two sample t-test for a t critical table? |
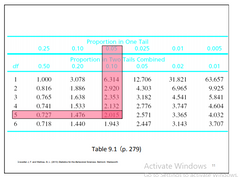
Adddf 1 and df 2 to calculate df and use as per normal |
|
|
|
Two sample T-test assumptions? |
- Independence assumption - Population distributions are normal - homogeneity of variance |
|
|
|
What is homongenity of variance? |
The variance of two samples does not have to be exactly the same but should not be stat sig different. Ad |
|
|
|
What do you do if homogenity of variance is violated? |
adjust the df. Smaller DF= Larger t critical value. |
|
|
|
What is the levenes test? |
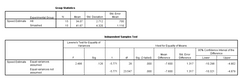
How Spss accommodates violations of homogeneity of variance. If violated we look at the bottom row. |
|
|
|
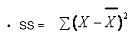
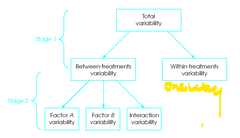
What is a One Way Anova? |
1 independent variable to test for Sig difference between 3 or more independent sample means (levels). Interested with the variability between (population mean variance) and within (spread of scores) Groups. |
|
|
|
What is Analysis of Variance? |
Spread of scores within groups |
|
|
|
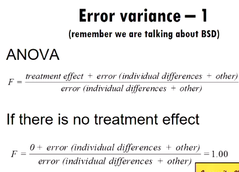
TEST: What is SS? |
The sample variance is the sum of squares divided by N-1 |
|
|
|
What is an Alternative hypothesis? |
Mean may be the same between two groups but not that third |
|
|
|
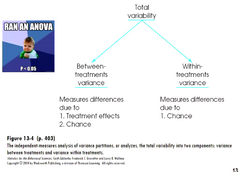
If F=1 no treatment effect |
|
|
|
Focus only of F score for exam |
|
|
|
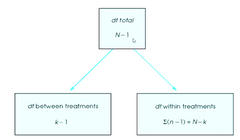
|
DF+1= Sample Size. K= number of levels (groups) |
|
|
|
What is an F Obtained critical value? |
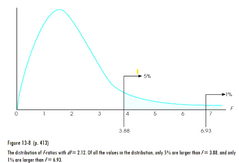
F obtained critical value 3.88-A of .05 |
|
|
|
What is a DF denominator? |
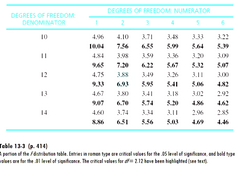
Df within |
|
|
|
What are the Assumptions of a one way anova? |
- Independence of scores - Normal population distribution (ok with some violations) - Homogeneity of variance |
|
|
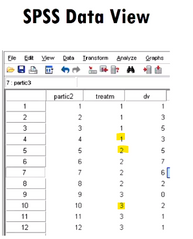
Is this Data WSD or BSD? |
BSD |
|
|
What is the Df? |
Df+1for pop and levels 2 IV levels+ 12+df1= 15 |
|
|
|
Does an Anova one way show where a difference is? |
No, only that there is one. Use Tukey test to find out where |
|
|
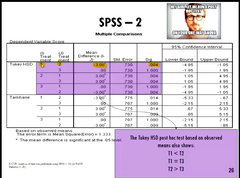
Interpret this Tukey test: Where is their a sig difference? |
T1 |
|
|
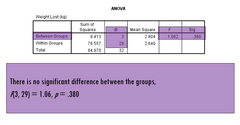
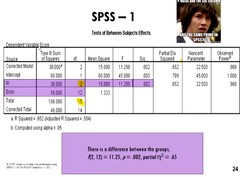
Interpret this data: How many participants? what about the F? |
N=32. F=1.062 Not sig. Write up: F (3,29)=1.06, p=.380 |
|
|
|
What is a Factorial Anova? |
Two IV. Only 1 DV with levels. Two factors as such two way anova. (puppet example) |
|
|
|
What is an Interaction effect (EXAM)? |
An interaction occurs when the effect of one factor on the dependent variable is not the same at all level of the other. example: effect of puppet types on cookies eaten is not the same for binge eaters and non binge eaters |
|
|
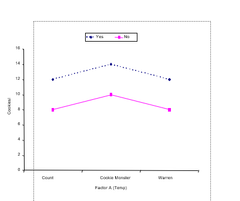
What is this an example of? |
Interaction effect |
|
|
|
What is a main effect? |
the overall effect of one factor not considering the other. example: Binge eats more than non-binge |
|
|
|
What are the 3 answer a factorial anova gives? |
- main effect for factor a (puppets) -Main effect for factor b (eating style) - A vs B interaction (eatingxpuppet) |
|
|
|
What is the difference between an One way anova & factorial anova? |
|
|
|
|
Exam: Factorial Anova assumptions |
- Independence Normal distribution Homogeneity of variance (robust to violations) |
|
|

Exam: Interpret this factorial Spss data: What does it tell us? |
Gender +HR Non-sig Exercise +HR sig Gender x exercise interaction= sig |
|
|
|
What is Effect size? |
Name given to afamily of indices that measure the magnitude of a treatment effect. Indices areindependent of sample size. Size of thedifference between two groups measured in SD units. = Cohens D. Strength ofassociate between two variables= Pearons R |
|
|
|
What test is a Cohens D for? |
T-test |
|
|
|
What is a Cohens D effect size? |
Small= 0 Medium= 0.2 Large= D>0.8 |
|
|
|
What is a pearsons R used for? |
Effectsize is measured as the association (linear) between two variables(Correlation) then we use Pearson's R. |
|
|
|
What is a Small, Medium and Large effect size? |
Small= r -.10 & +10 Medium= Between .10 - .40 Large= Greater or lesser than -.40 & +.40 range between -1 +1 |
|
|
|
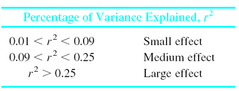
What is Pearsons R squared? |
Pearsons R-squared is the amount of DV variance explained by the IV. More circles over lap greater the DV is explained by the IV |
|
|
|
What is a Small, Medium & Large R squared? |
|
|
|
|
How do you write up a T-test with R squared results? |
M=x.xx, SD=x.xx) Significantly different from the test value (56.78), t(xx)= x.xx, p=.xx (one-tailed), d=x.xx [95% CI x.xx, x.xx] |
|
|
|
What is a 95% confidence interval? |
95% confident that the population mean is captured in the test results |
|
|
|
What is a Cohens F? |
Ratio of variance explained to the variance unexplained (no upper limit to the F value) |
|
|
|
Is an effect size dependent on a sample size? |
NO. |
|
|
|
How many error types are there? |
3 error types. Type 1, Type 2, Type 3. |
|
|
|
What is a type one error? |
Reject null hypothesis when actually true |
|
|
|
What is a type two error? |
Accept the null hypothesis when it is false |
|
|
|
What is a Type 3 error? |
predicting the inverse of the true relationship (only in directional relationships) |
|
|
|
What is the chance of a type 2 error (beta)? |
20% chance |
|
|
|
What is the chance of a Type 1 error (alpha)? |
0.5% |
|
|
|
What is statistical power? |
How likely is a result to be true. Probability of finding a significant result. |
|
|
|
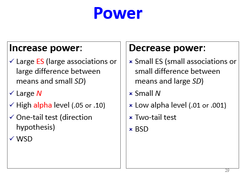
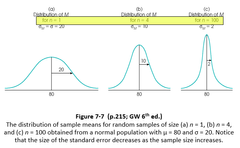
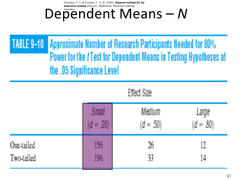
What increases statistical power? |
A Larger Sample size = less sampling error |
|
|
|
Is there a relationship between a Type 1 (alpha) error and a Type 2 (Beta) error? |
Yes. When Alpha increases we decrease beta and increase our Stat power. |
|
|
|
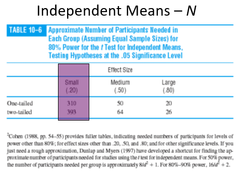
What are the 3 detriments of power? |
- Sample size - effect size - P-level |
|
|
|
What are 3 features which increase power and 3 features which decrease power? |
|
|
|
|

|
|
|
What does an independent mean do to power? |
Greater the population the greater the power |
|
|
|
What z-score would make the most power? |
a lower z score |
|
|
|
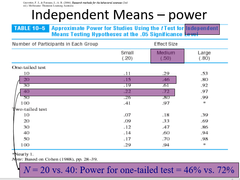
EXAM:What benefit does a One tailed test have with regards to power? |
Larger alpha and as such greater power. Better than two tailed test however this is a gamble as we may miss an association |
|
|
|
What do you do if a small sample size is unavoidable? |
1 tailed test, within subjects, look at only extreme scores to strengthen effect size. this would decrease your population. |
|
|
|
|
|
|
|
What do non parametric tests have? |
They do not use assumptions |
|
|
|
what is Kurtosis? |
Peakedness |
|
|
|
What is leptokurtic? |
Very peaked |
|
|
|
What is Platokurtic? |
Flat |
|
|
|
What does X2 mean? |
Chi square symbol |
|
|
|
What is goodness of fit? |
Comparing frequencies of one nominal variable to theoretical expectations |
|
|
|
what is Independence (contingencies)? |
Comparing frequencies of one nominal variable for different values of second nominal variable |
|
|
|
What is a Chi square value? |
If the fit is good then the X2 valye will be small. Less than the critical value for X2 reject null. So we want bad fit. Chi square will be large is chi square is large. |
|
|
|
Exam: What is Observed Vs expected? |
Expected: can be fractions (calculated based on the proportions) Observed are always whole numbers (dealing with individual samples) |
|
|
What is the CV? What is C? what is R |
CV is critical value. C= categories. R= standarised residual. If R is greater than + or -2 contributes to the significance of the chi square |
|
|
|
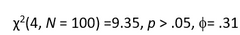
How do you write up a chi square result? |
|
|
|
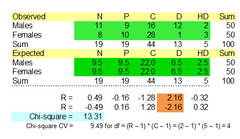
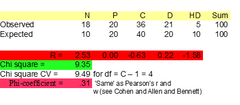
What does this table tell us? (contigency chi square) |
Chi square greater than Chisquare CV- as not non-significant difference |
|
|
|
What effect size tests are used for a Chi square? |
Phi Coefficient for 2X2 Cramers V for larger tables Small= .1 Meduim=.3 Large=.5 |
|
|
|
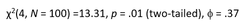
How do you write up these results? |
|
|
|
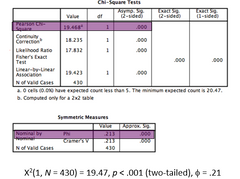
What does this tell us? |
Chi square result was significant and the effect size was also significant. Phi cause 2x2. |
|