![]()
![]()
![]()
Use LEFT and RIGHT arrow keys to navigate between flashcards;
Use UP and DOWN arrow keys to flip the card;
H to show hint;
A reads text to speech;
104 Cards in this Set
- Front
- Back
|
Focusing on risk, return and the importance of diversification. What are some risk measurements commonly used in finance? (4) |
1. Standard deviation 2. Semi-variance 3. Probability of shortfall 4. Expected shortfall |
|
|
Most conventional portfolio theory uses standard deviation as the basic measure of risk. Describe standard deviation (sigma) in risk measurement: |
SD is an historic measure which measures how far our instrument is above and below the mean (how far we've deviated from our central tendency). It is an ex-post measure - i.e after the event (hence historical). |
|
|
What is the issue with using standard deviation to measure risk? (4) |
1. Market returns are negatively skewed (so the mean is smaller). 2. It is based on past patterns of returns, which may not be representative of future patterns in returns. 3. it is a measure of upside movements as well as downside movements. In investment management, the concern may generally be about the downside alone. 4. Volatility generally is not a complete measure of risk. For example, inflation risk may affect non-growth assets. |
|
|
The objectives of a fund are to maximise returns of match projected liabilities. An investment strategy that has a higher expected return than another strategy, but the same or lower level of risk, is said to be what? |
dominant |
|
|
Alternative measures of risk (other than SD) include what? (3) |
1. Semi-variance 2. Probability of a shortfall 3. Expected shortfall |
|
|
What is semi-variance? |
Semi-variance is similar to variance, but only measures those returns over a period that fall below average (mean). This means it is a downside measure of risk, focusing on clients' concern of achieving below-average return. |
|
|
What is probability of shortfall? |
Probability of shortfall is a measure of risk that identifies the chance of a return over a specific period falling below a target level. It only measures chance, and does not give the value of the shortfall. |
|
|
What is expected shortfall? (ES) |
ES is a measure of expected loss at a given probability level. |
|
|
ES is a measure of expected loss at a given probability level. Describe this: |
For example, in the 5% of worst cases, the expected loss in value of a portfolio in the next year might be £5m. It is an absolute measure of risk that requires an assumption about the distribution of expected returns to be made. For example, this 5% of worst cases may be based on a historic distrubution, which assumes that this will be the worst year out of the last 20 (1/20 = 0.05 0r 5%). |
|
|
Another issue to consider in assessing SD is that the measure may understate the riskiness of an asset if the returns are not independent across time periods. Explain this: |
For example, if there is any form of autocorrelation present in returns, the standard deviation will understate the risk. This factor can be material, for example, in property and some hedge funds, as well as in unquoted assets and any investment where any form of 'smoothing' occurs in return series. |
|
|
So far we have mentioned 4 measures of risk. List these and provide a description: |
1. Standard deviation - an ex-post/historic measure that measures the dispersion of the market above and below the mean. 2. Semi-variance - variance of returns below the mean and hence a better measure of downside risk. 3. Probability of shortfall - chance of returns falling below a target level. 4. Expected shortfall - expected loss at a given probability. |
|
|
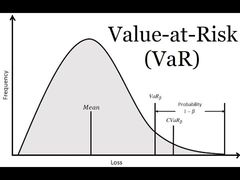
VaR, drawdown and tracking error are other popular measures of risk. Describe VaR: |
Estimates the size of losses at a given frequency e.g £10m 2.5% the loss for a 2 SD move i.e 2.5% probability we could loose more than £10m. |
|
|
VaR estimates the size of losses at a given frequency. It can be done either ex-post or ex-ante (before the event). Describe this: |
1. Historic (ex-post) - basing our analysis on past/historical information. 2. Monte Carlo scenario analysis (ex-ante) - this involves forecasting, using random simulation of variables. |
|
|
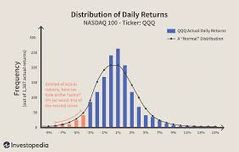
However, it is important to note that with VaR and historical models, markets aren't necessarily normally distributed. What do we observe? |
We observe negative skew and fat tails - so a greater frequency of losses.
|
|
Negative skew (data skewed to the left) and fat tails - so a greater frequency of losses. |
|
|
|
Another measure of risk is drawdown. What is this? |
Drawdown is an ex-post measure which looks at the decline from peak value over a given timeframe. |
|
|
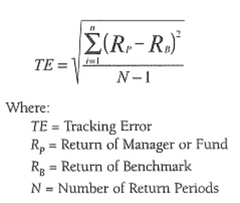
Another measure is tracking error (TE). Describe TE: |
SD of the surplus return to benchmark (also known as 'active risk' or 'managers risk'). The aim is to keep tracking error to a minimum. |
|
|
TE is the SD of the surplus return to benchmark (also known as 'active risk' or 'managers risk').The aim is to keep tracking error to a minimum. What is the equation for TE? |
|
|
|
Going into more detail on VaR. VaR analysis is used to estimate the capital loss on a portfolio or an individual asset over a given time period that will be exceeded with a given frequency or probability. There are 3 key features in understanding the concept of VaR, what are these? |
1. Time period 2. a confidence or probability level 3. a loss amount or percentage |
|
|
VaR is sometimes associated with the term 'maximum loss' i.e what is the most an investor can expect to lose with, say, 99% confidence over the next day? |
They can, of course, potentially lose everything on an asset or portfolio, so the word 'maximum' must be used with care. What VaR actually means is that on only 1% of occasions, can the investor expect to lose more than the said amount (e.g £10m) |
|
|
There are 3 ways to calibrate VaR, these are: |
1. Historical return approach 2. variance-covariance method 3. monte carlo approach |
|
|
What does the historical return approach do? |
The historical return approach (so-called backtesting or simulation models) simply reorganizes past returns from high to low and assumes history will repeat itself. |
|
|
What does the variance-covariance method do? |
The variance-covariance method, which assumes that the daily returns follow a normal (or similar) distribution. |
|
|
What does the Monte Carlo approach do? |
The Monte Carlo approach involves developing a mathematical model for stock price returns and running multiple hypothetical trials of the model. The term refers to any method that randomly generates trials, though the underlying parameters of the model may reflect historical experience of, say, mean and SD. The random numbers used in these key inputs are then repeated many times and produce a distribution of possible values that are considered plausible. |
|
|
The Monte Carlo approach involves developing a mathematical model for stock price returns and running multiple hypothetical trials of the model. The term refers to any method that randomly generates trials, though the underlying parameters of the model may reflect historical experience of, say, mean and SD.The random numbers used in these key inputs are then repeated many times and produce a distribution of possible values that are considered plausible. Using this set of generated outcomes, we can then make a statement, just as in the historical approach, such as: |
That on 1% of occasions the method produced losses worse than x%. In VaR terms, we can say that on 99% of occassions, we do not expect to lose more than x% in any one day. |
|
|
VaR is often scaled with the square root of time rule. Describe this: |
The SD of say, stock returns, increases with the square root of time (T). E.g imagine the daily SD of stock returns is 2% and there are 20 trading days in the calendar month and we want to scale the daily SD to a monthly SD: σ (monthly returns) = σ(daily returns) * √(T) so 2%* √20 = 8.94% |
|
|
Define statistical modelling: |
A form of financial modelling of future outcomes based on ranges of values (rather than single estimates) where the value for each unknown variable, such as investment returns and inflation, is based on a statistical likelihood. An example is Monte Carlo analysis. |
|
|
We compare fund performance to a benchmark. We use the concepts of risk vs return. In what situations is a portfolio said to be dominant? (2) |
1. Higher return for the same risk (as benchmark) 2. Same return for lower risk (than the benchmark) |
|
|
What is a portfolio's total risk made up of? |
Total risk = systematic risk + unsystematic risk |
|
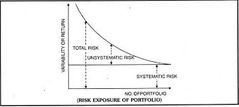
What is unsystematic risk? |
Unsystematic risk comprises of idiosyncratic / unique risk. It is specific to that particular investment. |
|
|
Can you reduce Unsystematic risk? |
Yes - you can reduce Unsystematic risk with diversification. |
|
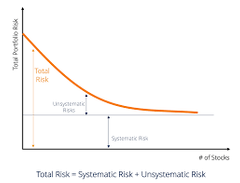
What is systematic risk? |
Systematic risk can't be mitigated with diversification. It is market risk that is measured by beta. |
|

This diagram represents modern portfolio theory. What does it show? |
Modern portfolio theory believes in increasing the number of securities to reduce risk. And what you are left with is systemic risk. |
|
|
Looking at correlation between asset classes. Recent correlations between asset classes can be shown via the correlation coefficient, what is the equation for this? |
r = covariance(x,y) / SD(x,y) so it is the covariance / SD. |
|
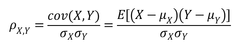
What does r range between? |
'r' ranges between -1 to +1. |
|
|
So we normalise the co-variance using the SD of x and y to determine r. How are efficient portfolios formed? |
Efficient portfolios are formed by adding assets with low (aka negative) correlations or low covariance. |
|
|
Efficient portfolios are formed by adding assets with low (aka negative) correlations or low covariance. This is the aim of modern portfolio theory, however some investors disagree with this theory... |
i.e Warren Buffet is very critical of modern portfolio theory - he believes you should invest in few companies but understand them well. |
|
|
Correlations converge to +1 when? |
Correlations converge to +1 in extreme market conditions. |
|
|
Note in the exam, take care with the data - are you given the variance or SD when being asked to determine the correlation coefficient (r)... |
remember SD = √variance or variance = SD^2 |
|
|
Looking at 2 of the main models of return and risk. One example is factor models and multi-factor models. What is a multi-factor model? |
A multi-factor model is a financial model that employs multiple factors in its calculations to explain market phenomena and/or equilibrium asset prices. The multi-factor model can be used to explain either an individual security or a portfolio of securities. It does so by comparing two or more factors to analyze relationships between variables and the resulting performance. |
|
|
Multi-factor portfolios are a financial modeling strategy in which multiple factors, macroeconomic as well as fundamental and statistical, are used to analyze and explain asset prices. For example, in these models it is assumed that asset prices are driven by a common set of factors, such as: |
inflation, industrial production, yield curve data etc. |
|
|
For example, in these models it is assumed that asset prices are driven by a common set of factors, such asinflation, industrial production, yield curve data etc. What do you then do to determine the return of the portfolio? |
Apply beta to each factor e.g Return of security = Beta(oil) + Beta(Index future).... Ri = ai + _i(m) * Rm + _i(1) * F1 + _i(2) * F2 +...+_i(N) * FN + ei Ri is the return of security iRm is the market return F(1, 2, 3 ... N) is each of the factors used _ is the beta with respect to each factor including the market (m) e is the error term a is the intercept |
|
|
Multi-factor models can be divided into three categories: macroeconomic models, fundamental models and statistical models. What do macroeconomic models compare? |
Macroeconomic models compare a security's return to such factors as employment, inflation and interest. |
|
|
Multi-factor models can be divided into three categories: macroeconomic models, fundamental models and statistical models.
|
Fundamental models analyze the relationship between a security's return and its underlying financials, such as earnings. |
|
|
Multi-factor models can be divided into three categories: macroeconomic models, fundamental models and statistical models. Statistical models compare what? |
Statistical models are used to compare the returns of different securities based on the statistical performance of each security in and of itself. |
|
|
Learn this equation for a multi-factor model of determining portfolio / security returns: |
Ri = ai + _i(m) * Rm + _i(1) * F1 + _i(2) * F2 +...+_i(N) * FN + ei Ri is the return of security iRm is the market return F(1, 2, 3 ... N) is each of the factors used _ is the beta with respect to each factor including the market (m) e is the error term a is the intercept |
|
|
Another model of return and risk is the capital asset pricing model (CAPM). What is CAPM? |
The Capital Asset Pricing Model (CAPM) describes the relationship between systematic risk and expected return for assets, particularly stocks. |
|
|
The formula for calculating the expected return of an asset given its risk using CAPM is: |
ERi=Rf+βi(ERm−Rf) where: ERi=expected return of investment Rf=risk-free rate βi=beta of the investment (ERm−Rf)=market risk premium |
|
|
ERi=Rf+βi(ERm−Rf) What does Rf stand for? |
Rf=risk-free rate(i.e cash equivalent) The risk-free rate in the CAPM formula accounts for the time value of money. |
|
|
(ERm−Rf) is called the market risk premium. What is this? |
The market risk premium is the difference between the expected return on a market portfolio and the risk-free rate. It provides a quantitative measure of the extra return demanded by market participants for the increased risk. |
|
|
Be careful with questions in the exam, some questions will give you the market risk premium and others will require you to calculate it (as the difference between the expected return on a market portfolio and the risk-free rate)... |
so remember if you are given the market risk premium, that the risk free rate has already been taken from this. |
|
|
Example Q) Calculate the return for a security, when Rf is 1%, Rm is 8% and βiis 1.1 |
= 1% + 1.1(8% - 1%) = 8.7 |
|
|
The goal of the CAPM formula is to evaluate whether a stock is fairly valued when its risk and the time value of money are compared to its expected return. For example, imagine an investor is contemplating a stock worth $100 per share today that pays a 3% annual dividend. The stock has a beta compared to the market of 1.3, which means it is riskier than a market portfolio. Also, assume that the risk-free rate is 3% and this investor expects the market to rise in value by 8% per year. What would the expected return of the stock be based on the CAPM formula? |
The expected return of the stock based on the CAPM formula is 9.5%: 9.5% = 3% + 1.3(8%-3%) |
|
|
The formula for CAPM is: ERi=Rf+βi(ERm−Rf) What are some limitations of CAPM? (4) |
1. CAPM assumes markets are perfectly competitive (ignores tax and transaction costs) 2. Assumes that investors always have the same risk vs. return expectations 3. Assumes investors can borrow / lend at the risk free rate (so it doesn't take into account different credit ratings) 4. Assumes investors always wish to maximize returns and minimize risk |
|
|
So there are several assumptions behind the CAPM formula which have been shown not to hold true in reality, such as: |
Modern financial theory rests on two assumptions: (1) securities markets are very competitive and efficient (that is, relevant information about the companies is quickly and universally distributed and absorbed); (2) these markets are dominated by rational, risk-averse investors, who seek to maximize satisfaction from returns on their investments. The CAPM also assumes that the risk-free rate will remain constant over the discounting period. |
|
|
The most serious issue with CAPM is the assumption that future cash flows can be estimated for the discounting process. Explain this: |
The most serious critique of the CAPM is the assumption that future cash flows can be estimated for the discounting process. If an investor could estimate the future return of a stock with a high level of accuracy, the CAPM would not be necessary. |
|
|
Note that the above deals with CAPM for equity securities but you may also be asked to calculate CAPM for bonds. How would you do this? |
Using duration as a measure of sensitivity (instead of beta) Duration = Duration of the bond / duration of market/index |
|
|
Remember, the market risk premium has already has the risk free rate removed... |
don't get caught out in the exam just add the betas. |
|
|
What is the formula for CAPM? |
ERi=Rf+βi(ERm−Rf) where: ERi=expected return of investment Rf=risk-free rate βi=beta of the investment (ERm−Rf)=market risk premium |
|
|
Describe the CAPM beta coeffcient (βi): |
This is a measure of the systematic risk of a security (or portfolio) relative to the market portfolio (benchmark index). |
|
|
Beta is a measure of the systematic risk of a security (or portfolio) relative to the market portfolio (benchmark index). What is the equation for the beta coefficient? |
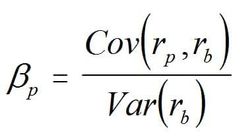
rp = return of the security rb = return of the market/benchmark |
|
|
The benchmark has a beta of what? |
The benchmark has a beta of 1. |
|
|
The benchmark has a beta of 1. Hence, a beta > 1 means what? |
A beta > 1 means more risk relative to the market portfolio (aggressive). |
|
|
A beta < 1 means what? |
A beta > 1 means less risk relative to the market portfolio (defensive) |
|
|
A portfolios beta is what? |
A portfolios beta is the sum of the individuals securities betas weighted accordingly. |
|
|
Note for bonds, we wouldn't be using betas, we would be using what? |
duration = duration of portfolio / duration of market/index |
|
|
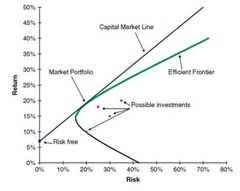
Using the CAPM to build a portfolio is supposed to help an investor manage their risk. If an investor were able to use the CAPM to perfectly optimize a portfolio’s return relative to risk, it would exist on a curve called the efficient frontier, as shown on the following graph. |
|
|

What does the graph show? |
The graph shows how greater expected returns (y-axis) require greater expected risk (x-axis). Modern Portfolio Theory suggests that starting with the risk-free rate, the expected return of a portfolio increases as the risk increases. Any portfolio that fits on the Capital Market Line (CML) is better than any possible portfolio to the right of that line, but at some point, a theoretical portfolio can be constructed on the CML with the best return for the amount of risk being taken. |
|
|
The CML and efficient frontier may be difficult to define, but it illustrates an important concept for investors: there is a trade-off between increased return and increased risk. |
Because it isn’t possible to perfectly build a portfolio that fits on the CML, it is more common for investors to take on too much risk as they seek additional return. |
|
|
Summarise CAPM: |
The CAPM uses the principles of Modern Portfolio Theory to determine if a security is fairly valued. It relies on assumptions about investor behaviors, risk and return distributions, and market fundamentals that don’t match reality. However, the underlying concepts of CAPM and the associated efficient frontier can help investors understand the relationship between expected risk and reward as they make better decisions about adding securities to a portfolio. |
|
|
What is the efficient market hypothesis? (EMH) |
The EMH states that securities prices will instantaneously reflect all available information. If true, then all securities will trade at their face value leaving no pricing anomalies to exploit. Hence the market portfolio cannot be outperformed. |
|
|
The EMH states that securities prices will instantaneously reflect all available information. What are the 3 forms of the hypothesis? |
1. Weak form 2. Semi-strong 3. Strong form |
|
|
Describe the weak form of the EMH: |
Weak form: prices already reflect all information contained in historic prices and volume, hence technical analysis is fruitless. The market may only be beaten through fundamental analysis or insider trading. |
|
|
Describe the semi-strong form of EMH: |
Prices reflect all past public information. |
|
|
Describe the strong form of EMH: |
The strong form is that prices reflect all relevant information both public and private. |
|
|
What is the condition for the EMH (which is one of its limitations)? |
That investors are rational |
|
|
So a big issue with the efficient market hypothesis is that it doesn't take into account investor biases. This leads us into the realm of behavioral finance. What are some concepts to consider? (2) |
1. Investors may not be rational 2. Investors make sub-optimal decisions |
|
|
There are a number of biases investors can be subject to, such as: |
1. Memory bias (misremembering how something occurred) 2. Overconfidence bias ('can't be wrong' thinking) 3. Confirmation bias - we only look for things that make us right 4. endowment effect - overpricing things 5. Prospect theory/ loss aversion 6. Anchoring - relying too heavily on a single piece of information. |
|
|
There is also a concept of financial amnesia. Describe this: |
Financial amnesia is when financial marketparticipants forget (or behave as if they have forgotten)the lessons from financial history. An example would be Asset Bubbles. |
|
|
Looking at pricing, liquidity and fair value. To determine fair value, we need to think about different styles of markets. One key aspect to consider is what? |
The liquidity of the market. i.e whether the market is liquid or illiquid. |
|
|
How can fair value be determined in liquid markets? |
In liquid markets, fair value can be determined from quoted prices. i.e quoted prices from active markets (preferred) - these are live, real-time prices on a constant basis. |
|
|
How can fair value be determined in illiquid markets? |
In illiquid markets, to determine fair value you can use: -Similar assets, not identical -Assumptions -Estimates may not be accurate leading to lower valuations |
|
|
In a liquid market, are bid-ask spreads wider or narrower? |
In liquid markets, bid-ask spreads are narrower. Liquidity narrows the spread. |
|
|
As well as the fair value and price of the actual security, investors also have to consider other costs, both explicit and implicit. Trading costs are a critical ingredient to any investment strategy. List some explicit transaction costs: |
-Transaction costs e.g brokerage commission and costs of platforms such as CCPs, CSDs etc. Brokerage commission is usually a fixed % of the capital amount of the transaction or a fixed amount per trade. |
|
|
List some implicit costs of trading: (4) |
- bid-ask spreads - price impact - opportunity costs - taxes and other charges |
|
|
Describe the concept of opportunity costs in implicit trading costs: |
If prices rise when spreading a large order over time. |
|
|
What are some taxes and other charges incurred in trading: |
e.g - SDTR - 0.5% of the purchase amount - PTM levy - flat fee- £1 on purchases in excess of £10K. |
|
|
Asset allocation is important in fund management. One approach is to use a top down approach, describe this: |
A top down approach chooses the assets classes and allocations first and leaves stock picking until last. |
|
|
In a top down approach, what is chosen first? |
A top down approach chooses the assets classes and allocations first and leaves stock picking until last. So we will decide the asset classes we will put into our portfolio, then choose the strategic weights and tactical range. Then give this framework to analysts to look for securities and look for price anomalies and opportunities. |
|
|
In contrast to top down, what is a bottom up approach? |
Bottom up approach uses fundamental analysis and constructs a portfolio of opportunities. |
|
|
In a bottom up approach, what is done first? |
Bottom up approach uses fundamental analysis and chooses stocks first to construct a portfolio of opportunities. So we are working from stock picking upwards. |
|
|
A bottom up approach allows stock pricing anomalies to determine the strategy of the fund. T or F? |
T - A bottom up approach allows stock pricing anomalies to determine the strategy of the fund. |
|
|
The above deals with strategic and tactical allocation as an approach to fund management. Another approach is active V passive fund management. If you believe in the efficient market hypothesis, which approach should you follow? |
Passive |
|
|
List the key features of passive investing: |
- Tracker funds - Low cost - Low tracking error - very IT / Computer intensive |
|
|
What is the aim with passive investing? |
To generate beta i.e to follow the market. |
|
|
List the key features of active investing: |
- looking to mispriced opportunities (you believe in the efficient market hypothesis) - More concentrated risk - Higher costs |
|
|
What is the aim with active investing? |
To generate +ve alpha, i.e to 'beat' or better the market. |
|
|
What is a combination strategy of active and passive investing called? |
Portfolio tilting. =combination strategy of active and passive investing strategies. |
|
|
You can also categorise fund management based on management style / portfolio construction. List 5 categories of portfolio construction: |
1. Growth 2. Value 3. "small cap" 4. "large cap" 5. Socially responsible investing (SRI) |
|
|
Define growth style of investing: |
Investing in securities with above average growth prospects (high PE ratios) Momentum investing |
|
|
In growth investing, it involves securities with above average growth prospects (high PE ratios). What is the P/E ratio? |
PE = Price / EPS It is essentially asking how many times does that actual performance go into the share price. If the P/E ratio is high, then it suggests that there is potential growth on the horizon. However P/E ratios need to be compared to other companies in the same sector. |
|
|
What is value investing strategy? |
With value investing, we look for undervalued securities (i.e those with a low P/E ratio) This strategy is associated with contrarian investors e.g Warren Buffet Looks for high yields |
|
|
With value investing, we look for undervalued securities (i.e those with a low P/E ratio), what does this suggest? |
Low P/E ratio means that price is low in relation to earnings which suggests there is not a lot of growth in future prospects. |
|
|
Value investing looks for high yielding companies, what is a measure of this? |
Dividend yield = dividend / price High dividend yield means the dividend is high in relation to the price. |