Reading...
![]()
Play button
![]()
Play button
![]()
Use LEFT and RIGHT arrow keys to navigate between flashcards;
Use UP and DOWN arrow keys to flip the card;
H to show hint;
A reads text to speech;
27 Cards in this Set
- Front
- Back
|
Number of births per 1000 people in a population is...
|
Crude birth rate
|
|
|
Number of deaths per 1000 people in a population is...
|
Crude death rate
|
|
|
70 / growth rate % is...
|
Doubling time
|
|
|
Birth rate minus death rate divided by 10 gives...
|
Growth rate percent
|
|
|
The amount of time it takes to double the size of a population is...
|
Doubling time
|
|
|
High birth rate and high death rate leads to....
|
stable population; phase I of demographic transition
|
|
|
High birth rate and low death rates lead to...
|
rapidly increasing population; phase II of demographic transition...
|
|
|
Dropping birth rate in phase III of demographic transition is called...
|
Fertility transition
|
|
|
Phase II of demographic transition is also called....
|
Epidemiological Transition
|
|
|
Why does fertility drop in phase III of demographic transition?
|
Many women choose to work or become educated and not have children.
|
|
|
The epidemiological transition is noted by...
|
better sanitation, health care, and disease prevention & cures.
|
|
|
Low birth rates along with low death rates lead to...
|
stable population characteristic of a developed country
|
|
|
Phase II and III are typical of which type countries
|
developing countries
|
|
|
The number of children a female gives birth to is called...
|
total fertility rate
|
|
|
A total fertility rate of 2.0 is called...
|
replacement level fertility
|
|
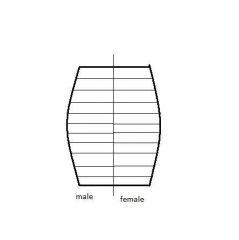
What will happen to the population size with this type of population pyramid?
|
It will shrink
|
|
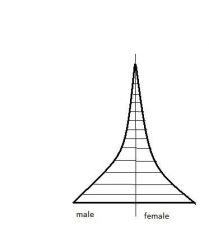
What will happen to the population with this kind of population pyramid?
|
It will increase rapidly.
|
|
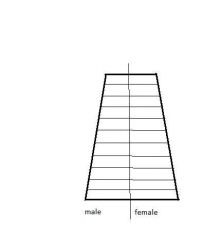
What will happen to the population size if a country has this population pyramid?
|
It will increase.
|
|
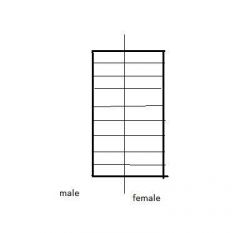
What will happen to population size in a population with this age structure graph?
|
It will remain constant. It will neither increase nor decrease.
|
|

What fertility rate does this age structure imply?
|
Less than 2 children per woman
|
|

What fertility rate does this age structure graph imply?
|
Much more than 2 children per woman
|
|

What fertility rate does this age structure graph imply?
|
More than 2 children per woman.
|
|

What fertility rate does this age structure graph suggest?
|
2 children per woman, which is called replacement level fertility
|
|
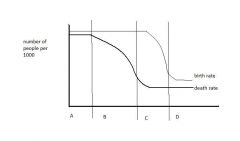
Which stages show stable population?
|
A & D, stages I & IV
|
|

Which stage of this demographic transition indicates rapid population growth
|
B, stage II
|
|

Which stages show "epidemiological" transition?...
and "fertility" transition? |
B: stage II = epidemiological
C: stage III = fertility |
|

Which stage shows fully developed countries, such as those of the west?
|
D: stage IV
|