![]()
![]()
![]()
Use LEFT and RIGHT arrow keys to navigate between flashcards;
Use UP and DOWN arrow keys to flip the card;
H to show hint;
A reads text to speech;
101 Cards in this Set
- Front
- Back
- 3rd side (hint)
|
Types of PMO |
Supportive pmo Controlling PLPMO Directive PMO |
|
|
|
Types of organisational structure |
Functional Project orientated Metric |
|
|
|
Historical information can include |
Activities WBS Benchmarks Reports Risks and risk response plans Estimates Resources used Project management plans Project documents Baselines Correspondence |
|
|
|
Content of assumption log |
assumptions Constraints |
|
|
|
Data gathering techniques |
Benchmarking Brain storming Prompt list Checklist Interviews Market research Questionnaires and surveys |
There are seven data gathering techniques |
|
|
Data analysis techniques |
Alternatives analysis Assumptions and constraints Cost benefit analysis Document analysis Earned value analysis Performance reviews Reserve analysis Root cause analysis Simulation SWOT Trend analysis Variance analysis What if analysis |
+ There are 13 data analysis techniques |
|
|
Data presentation techniques |
Affinity diagrams Cause and effect diagrams Control jobs Flu jabs Hierarchical charts Histograms Logical day tomorrow Matter today grams/chaps Mind mapping Probability and impact metrics Scatter diagram is Stakeholder engagement assessment matrices Stakeholder mapping /re-presentation Text oriented formats |
|
|
|
Decision making techniques |
Multi criteria decision analysis Working |
|
|
|
Communication techniques |
Active listening Feedback Presentations Meeting management Communication methods Communications technology |
There are six communication techniques |
|
|
Communication techniques |
Active listening Feedback Presentations Meeting management Communication methods Communications technology |
There are six communication techniques |
|
|
Interpersonal and team skills |
Conflict management Cultural awareness Decision-making Emotional intelligence Facilitation Influencing Leadership Meeting management Motivation Negotiation Networking Observation/conversation Political awareness Including |
There are 14 interpersonal and team skills |
|
|
Estimating techniques |
Estimating Analogues Bottom up Top down Expert judgment |
|
|
|
Project management process groups |
Initiating Planning Executing Monitoring and controlling Closing |
There are five project management process groups |
|
|
Define Progressive elaboration |
Add information here |
|
|
|
Define Progressive elaboration |
Add information here |
|
|
|
Define rolling wave planning |
The technique of rolling with planning is a form of progressive elaboration. The earliest parts of the project plan in sufficient detail for work begin. Little phases of project work are planned at High level. as the project progresses and more information impacting the work becomes available, plans are elaborated in sufficient detail to accomplish the work. |
|
|
|
The integration management process |
4 .1 Develop project charter 4.2 Develop project management plan 4.3 direct and manage project work 4.4 manage project knowledge 4.5 monitor and control project work 4.6 perform integrated change control 4.7 close project or phase |
|
|
|
Project selection Benefit measurement methods |
A murder board Peer review Scoring models Economic measures |
|
|
|
Project selection Constrained optimisation methods ( mathematical approach) |
Linear programming Integer programming Dynamic programming Multi objective programming |
|
|
|
Economic measures for project selection |
Return on investment ( ROI) Present value (PV) Net present value (NPV) Internal rate of return (IRR) Pay back period Cost benefit analysis Economic value added (EVA) Opportunity cost Sunk cost Law of diminishing returns Working capital Depreciation |
|
|
|
Types of Depreciation |
Straight line depreciation Accelerated depreciation |
|
|
|
Inputs To project charter |
Business Case Benefits management plan Constraints and assumptions Agreements/contacts |
|
|
|
Inputs To project charter |
Business Case Benefits management plan Constraints and assumptions Agreements/contacts |
|
|
|
Contents of project charter |
Project title and description Project manager assigned and authority level Business case Resources preassigned Key stakeholder list Stakeholder requirements as known High-level product description/Key deliverables High-level assumptions High-level constraints Measurable project objectives Project approval requirements Overall project risks Project exit criteria Project sponsors authorising this project |
|
|
|
Types of baselines |
Scope baseline Schedule baseline Cost baseline cost |
|
|
|
The scope management process |
5.1 plan scope management 5.2 collect requirements 5.3 define scope 5.4 create WBS 5.5 validate scope 5.6 control scope |
|
|
|
Scope management plan content |
How scope will be planned executed and controlled. |
|
|
|
Scope has two plans |
Scope management plan Requirements management plan |
|
|
|
WBS is the foundation of the project |
Outputs of WBSWBS goes goes to following Project control Activity list Network diagram Resources estimating scheduling Budgeting Quality management Risk management Procurement management |
|
|
|
WBS is the foundation of the project |
Outputs of WBSWBS goes goes to following Project control Activity list Network diagram Resources estimating scheduling Budgeting Quality management Risk management Procurement management |
|
|
|
There are four types of Logical relationships between activities in schedule management |
Finish to start (This is the most common used relationship) Start to start Finish to finish Start to finish |
|
|
|
Types of dependencies schedule management. |
Mandatory dependency (hard logic) Discretionary dependency (Preferred, preferential, or Soft Logic) External dependencies Internal dependency |
|
|
|
What is lead? |
Lead may be used to indicate that an activity can start before it’s predecessor activity is completed. Activities are done in parallel. |
|
|
|
What is lags? |
A lag is waiting time inserted between activities such as needing to wait three days after pouring concrete before constructing the theme for the house. More Time or days added between activities. |
|
|
|
Project schedule network diagram |
A Flow of project activities in the logical order in which they will be performed. |
|
|
|
Assumption log |
Assumptions or constraints that contribute to risk within the activities to estimate it can be found in the assumption log. |
|
|
|
Assumption log |
Assumptions or constraints that contribute to risk within the activities to estimate it can be found in the assumption log. |
|
|
|
Resource breakdown structure |
Created in the estimate activity resources process of resource management, the resource breakdown structure represents categories of resources required for the project. |
|
|
|
Resource requirements |
These requirements indicates the skill levels of resources required to perform specific project work. |
|
|
|
Project team assignment |
Project team assignments should include the number and experience level of individuals who have been committed to the project. |
|
|
|
Project team assignment |
Project team assignments should include the number and experience level of individuals who have been committed to the project. |
|
|
|
Resource calendars |
This calendars provide information on when key resources with specialised skills needed for project activities will be available if the resources are not available within the timeframe of your project, you may need to add extra time to some activities estimates, allowing for less experienced resources to do the work |
|
|
|
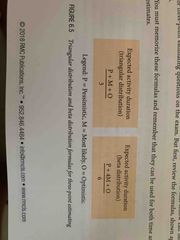
Types of estimating techniques |
One point estimating Analogous is estimating (top-down) Parametric estimating (regression analysis {scatter diagram}, learning curve) Heuristics Three point estimating 1 Triangular distribution {simple average} 2. Beta distribution {weighted average Bottom up Estimating Data analysis 1.Alternatives analysis 2.Reserve analysis Decision-making |
|
|
|
Types of float |
Total float Free float Project float |
|
|
|
Fast tracking |
Is used in goody good but activities. Activities are done in parallel instead in series. Fast tracking often results in rework, increases the risk, and requires more attention to communication. |
|
|
|
Fast tracking |
Is used in goody good but activities. Activities are done in parallel instead in series. Fast tracking often results in rework, increases the risk, and requires more attention to communication. |
|
|
|
Crashing |
This technique involves adding or existing resources in order to compare book schedule while maintaining the original project scope. Crashing by definition always results in increased cost and may increase the risk. it trade time for money. |
|
|
|
Monte Carlo analysis |
The technique uses computer software to simulate the outcome of project based on three point estimates (optimistic, pessimistic, and most likely )for each activity and the network diagram |
|
|
|
Resource optimisation technique |
Resource levelling Resource smoothing |
|
|
|
What is resource levelling? |
Resource levelling is a resource optimisation technique that allows you to level the peaks and valleys of the schedule from one month to the other, resulting in a more stable number of resources. |
|
|
|
What is resource levelling? |
Resource levelling is a resource optimisation technique that allows you to level the peaks and valleys of the schedule from one month to the other, resulting in a more stable number of resources. |
|
|
|
What is resource smoothing? |
A modified form of resource levelling, where resources are levelled only within the limits of the float of their activities, so the completion date of the activities are not delayed |
|
|
|
What is schedule data? |
Schedule data encompasses all the data used to create the schedule model, including milestones, project activities, activities attributes, duration estimates, dependencies, and the assumptions and constraints used in creating that schedule. |
|
|
|
What is life cycle costing? |
This concept involves looking at cost over the entire life of the product, not just the cost of project to create the product. It includes the cost of maintenance of the product and project. |
|
|
|
What is value analysis? |
This concept is sometimes referred to as a value engineering. Its focuses on finding a less costly way to do the same work. in other words this technique is used to answer the question, “how can we decrease cost on the project while maintaining the same scope? Value analysis refers to finding ways to provide required features at lowest cost without loss of performance. |
|
|
|
Types of cost |
Variable cost Fixed cost Direct cost Indirect cost |
|
|
|
Types of cost |
Variable cost Fixed cost Direct cost Indirect cost |
|
|
|
What is variable costs? |
This costs change with the amount of production or the amount of work for example include the cost of material, supplies, and wages. |
|
|
|
Types of cost |
Variable cost Fixed cost Direct cost Indirect cost |
|
|
|
What is variable costs? |
This costs change with the amount of production or the amount of work for example include the cost of material, supplies, and wages. |
|
|
|
What is fixed costs,? |
This cost will not change as production changes for example include the cost of setup , rent, utilities etc |
|
|
|
What is direct costs? |
These costs are directly attributable to the work on the project. E.g. the team wages, team travel and recognition expenses, and costs of material used on the project. |
|
|
|
What is direct costs? |
These costs are directly attributable to the work on the project. E.g. the team wages, team travel and recognition expenses, and costs of material used on the project. |
|
|
|
What is indirect cost? |
Indirect costs are overhead items or costs incurred for the benefits of more than one project. E.g include taxes, fringe benefits and janitorial services. |
|
|
|
Types of estimate ranges |
Rough order of magnitude (ROM )estimate Budget estimate Definitive estimates |
|
|
|
How to determine budget? |
1 activity estimates 2 Work package estimate 3 control account estimates 4 project estimates 5 contingency reserves 6 cost baseline 7 management reserves 8 cost budget |
|
|
|
PV |
Planned value |
|
|
|
PV |
Planned value |
|
|
|
EV |
Earned value |
|
|
|
AC |
Actual cost |
|
|
|
AC |
Actual cost |
|
|
|
BAC |
Budget at completion |
|
|
|
EAC |
Estimate at completion |
|
|
|
ETC |
Estimate to complete |
|
|
|
VAC |
Variance at completion |
|
|
|
Formulas – cost variance |
EV- AC |
|
|
|
Formulas – cost variance |
EV- AC |
|
|
|
Formulas – schedule variance |
EV- PV |
|
|
|
Formulas – cost performance index |
EV /AC |
|
|
|
Formulas – cost performance index |
EV /AC |
|
|
|
Formulas – schedule performance index (SPI) |
EV/PV |
|
|
|
Estimate completion (EHC) |
AC+ Bottom-up ETC This formula calculates actual costs to date plus a revised estimate for all the remaining work. It is used when the original estimate was fundamentally flawed. |
|
|
|
Estimate completion (EHC) |
AC+ Bottom-up ETC This formula calculates actual costs to date plus a revised estimate for all the remaining work. It is used when the original estimate was fundamentally flawed. |
|
|
|
Estimate at completion (EAC) |
BAC/ CPI This formula is used if no variances from BAC have occurred or if you will continue at the same rate of spending (as calculated in your cumulative CPI or based on the trends that have led to the current CPI) |
|
|
|
3. Estimate at completion (EAC) |
AC+ (BAC-EV) This formula calculates actual costs to date plus remaining budget. It is used when current variances are thought to be atypical of the future. It is essentially AC plus remaining value of the work to perform. |
|
|
|
3. Estimate at completion (EAC) |
AC+ (BAC-EV) This formula calculates actual costs to date plus remaining budget. It is used when current variances are thought to be atypical of the future. It is essentially AC plus remaining value of the work to perform. |
|
|
|
4 Estimate at completion (EAC) |
This formula calculates actual to date Budget modified by performance. It is used when current variances are thought to be typical of the future and when project schedule constraints will influence the competition of the remaining effort. So for example, it might be used when cumulative CPI is less than one and a firm completion date must be met. |
|
|
|
To complete performance index (TCPI) |
(BAC- EV) / (BAC- AC) This formula divides the value of the work remaining to be done by the money remaining to do it.it answers the question “to stay within budget, what rate do we need to meet for work? “ Greater than one is bad; less than one is good |
|
|
|
Estimate to complete (ETC) |
Estimate to complete (ETC) |
|
|
|
Estimate to complete (ETC) |
EAC - AC How much more will the project cost? This formula calculates the total project cost as of today minus what has been spent to date. Do you estimate the remaining work from the bottom up. |
|
|
|
Variance at completion (VAC) |
BAC- EAC How much over or under budget will we be at the end of the project? |
|
|
|
The quality management process |
Plan quality management Manage quality Control quality |
|
|
|
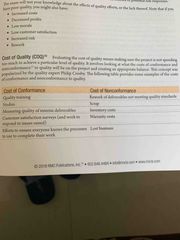
Cost of quality (COQ) |
Evaluating the cost of quality making sure the project is not spending too much to achieve a particular level of quality. It involves looking at what the cost of conformance and nonconformance to quality will be on the project and creating an appropriate balance. This concept was popularised by quality export Philip Crosby. Please see the below table |
|
|
|
Logical data models |
The logical data model can be presented using an entity relationship diagram - a method of representing and analysing data. A logical data model contains a description of the quality needs to the project. It is used to understand the requirements, clarify business rules, and define processes. It can be used to create and refine quality plans that best meet the needs of the project. |
|