![]()
![]()
![]()
Use LEFT and RIGHT arrow keys to navigate between flashcards;
Use UP and DOWN arrow keys to flip the card;
H to show hint;
A reads text to speech;
177 Cards in this Set
- Front
- Back
|
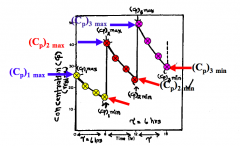
Plasma Concentration vs. Time Profile of the Administration of a Drug by an IV Infusion when the Infusion is Stopped at Two Different Times |
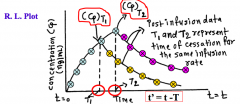
CpT value depends on what time we stop the infusion - The highest Cpss we can get occurs when time = infinity Post-infusion data are parallel. If we plot on SL paper, we will get straight line and slope will give us K and t1/2 Cp depends on time we stop infusion- highest is Cpss- true steady state at time infinity. - Post infusion- yellow and purple. The lines are parallel- plot on SL will be straight. Slope lets you find K then can fin T. |
|
|
Drug Amount and Plasma Concentration after Cessation of IV Infusion |
The amount of drug in the blood (X), the plasma concentration (Cp), and the rate of elimination (dX/dt) of a drug at the time of cessation of infusion will depend on the infusion rate (Q) and the time (T) of cessation of the infusion -- The higher the infusion rate (Q) and longer the duration (T) of infusion, higher will be the amount of drug, the concentration of drug, and the rate of elimination - After attaining true steady state condition for a chosen infusion rate, there will be NO change in the value of any of them If you infuse the drug for longer period of time, all values (Cp, etc) will be higher. The highest rate of elimination you can get is equal to infusion rate. - If you double the infusion rate, all these parameters will be directly proportional to infusion rate at time t |
|
|
Use of Post-Infusion Plasma Concentration Data |
Determine elimination half-life, elimination rate constant (K), and apparent volume of distribution (V). Cp' = CpT.e^-Kt' Always use the approach to determine t1/2 and V by getting info from IV bolus, but we can use this approach too. IV Bolus: Cp = Cp0e-Kt -Conc. declines with respect to time on both equations -CpT and Cp0 are different -CpT is plasma conc. at time we stop infusion When we plot Cpt graph vs time, y-int will give u Cpt (time we stop IV infusion) |
|
|
SL Plot of Plasma Concentration vs. Time Following Cessation of Infusion (i.e. post-infusion) |
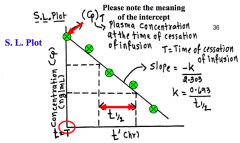
Compare to IV bolus: same exact profile
- Cp0 for IV bolus (initial concentration) - CpT for IV infusion (plasma concentration at time we stop infusion; this time doesn't always mean true steady state, it could be any time) Then we can calculate t1/2 and K |
|
|
From the plot of concentration vs. time, we can... |
1. Determine elimination half-life (t1/2) and the elimination rate constant (K) 2. Intercept = CpT = XT/V; this approach is NOT practical since we do not know the value of XT 3. Absolute value of CpT and XT and rate of elimination are time dependent 4. With no loading dose (DL), ------ CpT = (Q/V.K) (1 - e^-KT) When T = ∞, CpT = Cpss = Q/V.K In this case there's no DL, only in IV infusion. Remember: T is time we stop the infusion (time must be the same as the concentration time) |
|
|
Equation of Apparent Volume of Distribution from Post-Infusion Data |
V = [Q / (CpT.K)] (1 - e^-KT) |
|
|
Equation of Apparent Volume of Distribution from Post-Infusion Data, when T = ∞ |
T = ∞, CpT = Cpss V = Q / (Cpss.K) |
|
|
Equation of Apparent Volume of Distribution from Post-Infusion Data, when T = t |
V = [Q / (Cpt.K)] (1 - e^-Kt) |
|
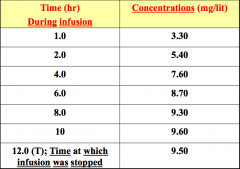
Plasma concentrations during period when a drug was infused at a constant infusion rate (40 mg/hr) for 12 hours |
As you continue to infuse, the concentration should continue to increase - can get as high as Cpss (true steady state) - Time during infusion- as you continue to infuse drug, conc increase- can get high as Cpss- can’t get greater than that. Conc. is increasing. - 12 h- time stop infusion. 9.5- fluctuation can take place. In theory should be greater than at tim 10. When you try to measure, there can be error and that’s what we see. Could take last 2 numbers and mean so don’t have bias toward number. |
|
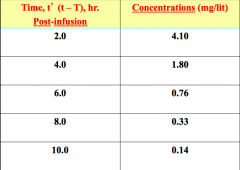
Plasma concentrations post infusion period when a drug was infused at a constant infusion rate (40 mg/hr) for 12 hours |
Concentrations decline with time When t' = 2 (2 hours since we stopped the infusion, so 12 + 2 = 14 hours from the beginning of the infusion, and 2 hours after we stopped infusion) - Concentration must decline with time in post-infusion period |
|
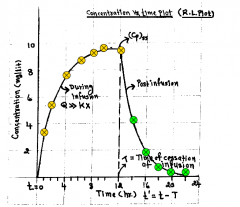
Concentration vs. Time Plot in RL paper of a drug administered by IV infusion |
Yellow dots: during infusion - As we begin to approach true steady state condition (beyond practical steady state), the graph begins to look asymptotic (plateau) - Cpss: theoretically only happens at time ∞, but once we go after 7-8 half-lives, we are really close to Cpss Green dots: post-infusion period |
|
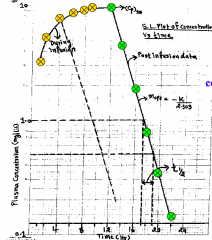
Concentration vs. Time Plot in SL paper of a drug administered by IV infusion |
From post-infusion concentration vs. time data: - t1/2 = 1.7 hr - K = 0.693/1.7hr = 0.407/hr - Apparent volume of distribution True steady state plasma concentration is 9.6 mg/L. Yellow dots: during infusion - Will NEVER be a straight line (graph looks same as RL paper) Green dots: post infusion period - Will give straight line on SL paper (no drug coming into the body) Dotted line: Once we stop infusion, regardless of which time, the post-infusion profile would be a straight line that would be parallel to the green-dotted line, so slope, K, half-life, V, and Cls wouldn't be different. BUT the concentration values would be different. |
|
|
In the example, cessation of IV infusion was at 12 hours, so Cpss... |
Time of cessation of infusion of 12 hours >>> 7.34 hours (4.32 x t1/2 of the drug) - Therefore, the difference between theoretical true steady state plasma concentration (Cpss) and the observed plasma concentration (9.6 mg/L) at the time of cessation of infusion (12 h) is insignificant to introduce a serious error in estimate of the parameter At what time will the ‘practical’ steady state was attained? 4.32 * t1/2 = 7h Did we stop infusion drug at t time after we reached practical steady state? We stopped infusion at 12 hrs, which is beyond practical state state, so we approaching true Cpss since we infused drug for more than 7t1/2 of the time. As we go beyond practical steady state condition, Cpt will be so close to Cpss, that it won’t be mathematically significant difference. |
|
|
Volume of Distribution Equations |
Cpss = Q / V.K CpT = Q / V.K (1 - e^-KT) T = time of infusion, pick concentration corresponding to that time. Both approaches will give little difference between V. |
|
|
Calculation for Steady State Plasma Concentration, Cpss |
Cpss = (Q x t1/2) / (V x 0.693) |
|
|
Loading Dose Calculation |
DL = Cpss x V DL = Q/K What if the infusion rate needed to reach conc. of half the conc.? Infusion rate would be half |
|
|
Rowland and Tozer Method |
Allows us to calculate half-life, elimination rate constant (K) for an administered drug by using plasma concentration vs. time data obtained during infusion period (i.e. we don't need plasma concentration values in the post-infusion period) If we don't have post-infusion conc. vs. time data, we call still calculate K and t1/2 provided we have infused the drug for sufficient period of time (beyond practical steady state) |
|
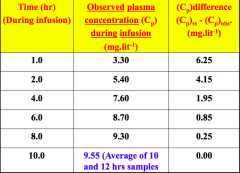
Rowland and Tozer Method Table |
Plot the difference between Cpss and Cpobs (i.e. Cpss - Cpobs) vs. time on SL paper (Cpdiff vs. time) Ex. 9.55 - 3.3 = 6.25 Plot will give straight line Then we can calculate half-life and K |
|
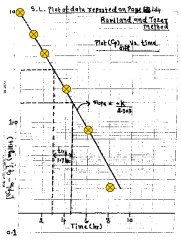
SL Plot of Cpdiff vs. Time |
Note: this method will yield accurate estimate of parameters provided if we infuse drug up until such time that we have gone beyond the 'practical' steady state condition (i.e. time of cessation of infusion is greater than 4.32 t1/2 of the drug) We can use this approach ONLY when we infuse drug for sufficient long period of time, beyond 4.32 half-lives of the drug!! |
|
|
Multiple Dosing Kinetics |
More frequently, drugs are administered on a continuous basis. - Most drugs are administered with enough frequency that significant levels of drug remain in the body when a subsequent dose is administered |
|
|
Multiple Dosing -- Drugs Administered in a Fixed Dose |
For drugs administered in a fixed dose and a constant dosing interval (ex. 250 mg q6h), the peak plasma level following the 2nd and succeeding doses of a drug is higher than the peak level following the administration of first dose. Dose and dosing interval is a fixed number. Ex. Same dose every 8 hours for 10 days. If I take Advil 800mg, and second 800mg in 8hrs. The 2nd administered dose will give higher concentration every time, and all successive doses will continue to give higher concentration. - 1st order: Constant % is being removed at a time - So once we keep administered succeeding doses we get higher concentration, but % of drug being removed is constant. |
|
|
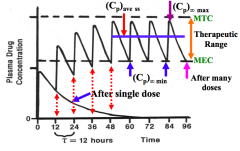
Multiple Dosing -- Drug Accumulation |
Drug accumulation in the body results, relative to the first dose. - At steady state, the plasma concentration of a drug at any point in time during dosing interval will be identical When a drug is administered on a continuous basis, the rate and extent of drug accumulation is a function of the relative magnitude of the dosing interval (tau) and the elimination half-life of the drug Minimum concentration at steady state compared to maximum concentration at steady state. Accumulation is influenced by dosing interval. -If we double dose, Cptmax will be higher and Cptmin will be higher so ratio won’t change Once we give same dose and dosing interval after 7-8 doses, Cpmax and Cpmin will be the same, average conc. will be same, and conc. at any time during that dosing interval will be the same (this only happens once we reach steady state condition). If I take drug more frequently, accumulation will be greater. If I take it less frequently, the accumulation will be smaller. Every drug has different half-life, so it’s the combination of the 2 that contribute to the accumulation of the drug. |
|
|
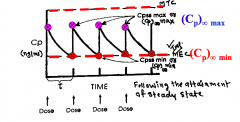
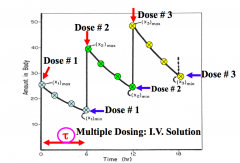
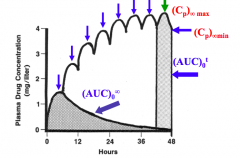
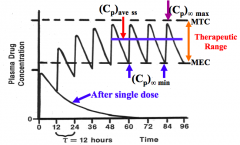
Plasma Concentration vs. Time Profile Following the Administration of Many Doses |
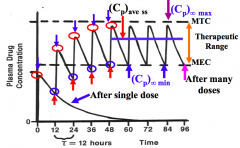
Multiple dosing kinetics: Plasma conc. vs. time profile following admin. of many doses (n is number of doses administered, and here n is greater than 7). In this case it’s the number of doses that allows us to reach steady state condition (not at time infinity like in IV infusion) - Let’s say that I admin. the first dose of the drug, and then we admin. 2nd dose and the dosing interval is 12h, then constant % is eliminated, then we give 3rd dose - We continue to get higher and higher conc., so max conc. is increasing from 1st dose to 7 dose, and after 7 doses, the Cp∞max is same, and max and min conc. are within the therapeutic range -This is the ideal situation – dose and dosing interval should be such that falls within the therapeutic range Occurs after 7-8 doses: - Cp∞max: once we reach max. conc. at steady state,the Cpmax doesn’t change - Cp∞min: once we reach min. conc. at steady state,the Cpmin doesn’t change So if pt continues to take same dose at same interval, patient will have continuous effect of drug within therapeutic range - Problems arise when pt doesn’t follow correct directions |
|
|
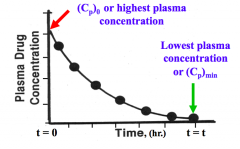
Recap: For a single IV Bolus Dose (One Compartment Model) |
X = X0.e^-Kt Cp = Cp0.e^-Kt at time = 0, X = X0 and Cp = Cp0 = Cpmax (highest plasma concentration) at time = ∞, X = 0 and Cp = 0 |
|
|
Recap: IV Bolus (One-Compartment) R.L. Plot of Concentration vs. Time |
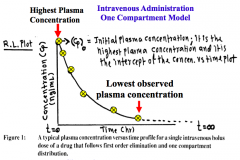
Highest plasma concentration occurs when time = 0 |
|
|
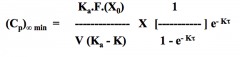
Recap: For a single EV dose (One compartment model) |
X = [(Ka.F(X0)) / (Ka - K)] (e^-Kt - e^Kat) Cp = [(Ka.F(X0)) / V(Ka - K)] (e^-Kt - e^Kat) At time = 0 and time = ∞, X and Cp = 0 At time = tmax (peak time), X = Xmax and Cp = Cpmax (peak plasma concentration) EV route: highest conc. is at tmax IV bolus: highest conc. is at time 0 |
|
|
Recap: Single EV Dose (One Compartment) in RL Plot -- Concentration vs. Time |
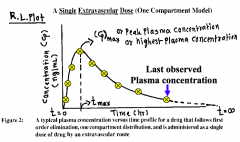
If you administer by EV route for one single dose: - Cpmax (peak plasma concentration takes place at tmax) - Max. concentration is when time is GREATER than 0, it’s at tmax - Tmax is when the rate of absorption = rate of elimination - Plasma conc. at time 0 is 0 For IV bolus: Cp0 is always highest and it's when time is 0 For multiple dosing: look at Cp∞max at time 0 for IV bolus; and Cpmax will ALWAYS be greater than time 0 for EV route, - t'max. EV and IV: Minimum concentration always occurs when time is equal to tau - But max. concentration occurs at diff. times |
|
|
Multiple Dosing Concepts: Concentration vs. Time Profiles |
Concentration vs. time after administration of an identical dose of a drug as an IV bolus. - Second dose was administered after a long interval (after than 10 half lives of the drug and thus, there's significant amount of drug left in the blood from the first dose. Administration of an identical IV bolus dose of a drug at t = > 10 half-lives |
|
Plasma Concentration vs. Time Profile of IV Bolus - Identical Dose of a Drug at an Identical Dosing Interval |
Note: Peak plasma concentration and plasma concentration at any given time for the 2nd and 3rd doses will be higher due to accumulation If drug is admin. at multiple dosing intervals at finite time: - This example is every 6 hours (tau = 6h) Cp1max is the same as Cp0, because this is IV bolus (highest conc.), Cp1min (in this case will happen at 6h). Min conc. will increase as we increase number of doses. The dose we administered is identical -So Cp1min + Cp0 = Cp2max Cp2max is the max. conc. after the 2nd dose is givenCp2min + Cp0 = Cp3max 1st order kinetics: Conc. % of the remaining amount is removed per time If u administer many doses (7-9 doses), you have the same max. conc. for each dose admin., and same min. conc. for each dose admin. – this only happens when u reach steady state condition Cpmax vs. admin doses: Cp∞max (already reached steady state condition) – max. conc. won’t change no matter how many doses u admin after that, only way to change is to change the dose |
|
Plasma Concentration vs. Time Profile of Identical Dose and Identical Dosing Interval as IV Bolus -- At Steady State |
Peak plasma concentration and plasma concentration at any give time after the attainment of steady state is identical After admin 8-7 doses, we have same max and min conc. for each dose- ONLY ONCE REACH SS CONDITION- 7,8,9 DOSES OF DRUG. Cpmax vs number of doses.. Cp∞max- already reach ss condition- max conc doesn’t change. Only way to change would be change dose or dosing interval |
|
|
Dosage Regimen Definition |
The systematized dosage schedule for a drug therapy or the optimized dose and dosing interval for a specific drug. |
|
|
Drug Accumulation Definition |
The build-up of a drug in the body due to sequential dosing. |
|
|
Steady State Condition Definition |
When, under a given dosage regimen, the amount of drug administered (for I.V) or absorbed (for oral) is equal to the amount of drug eliminated over a dosing interval |
|
|
Loading Dose Definition |
The dose administered to reach steady state condition instantly. |
|
|
Multiple Dosing Assumptions |
In obtaining expressions for multiple dosing, these assumptions may not always be valid - Linear pharmacokinetics apply (i.e. rate process obeys first order kinetics) - Tissues can take up an infinite amount of drug, if necessary - The apparent volume of distribution (V) and the elimination rate constant (K) are independent of the number of administered doses - Time interval between dosing or tau is going to be constant - Administered dose is equal at each time interval Linear PK = passive diffusion = 1st order process We keep admin. same dose of same drug to same patient, so body can take all drug we admin. to pt. Independent of dose: If I give15-20 doses, nothing happens to V or K or t1/2 of that drug. Ex. Once we decide the dosing interval is 6h, it's going to be fixed for that dosing regimen |
|
|
Useful PK Parameters in Multiple Dosing |
- The Dost ratio (r) - The amount (X) and concentration (Cp) of drug in the body at any time (t) during the dosing interval (τ) following the administration of a drug as an IV bolus and EV route. - The maximum and minimum amount and concentration [(Cp)n max and(Cp)n min] of a drug in the body following the administration of a drug as an IV bolus and EV route. - The steady state plasma concentrations (maximum, minimum, and ‘average’). - The maximum and minimum plasma concentrations at steady state [(Cp)∞ max and(Cp)∞ min] following the administration of a drug as an IV bolus and EV route. - The ‘average’ steady state plasma concentrations following the administration of a drug IV and EV. - Determination of drug accumulation (R) by different methods. - Determination of fluctuation (Φ) - Number of doses (n) required to attain a given fraction of steady state (fss) - Calculations of a loading (DL) and the maintenance dose (Dm) Dost ratio: allows us to convert single dose equation into multiple dose equation (Cp)nmax: the n represents number of doses – it’s the max concentration after n doses |
|
|
Important Notes about Cp∞max and 'average' steady state plasma concentration |
(Cp)∞max : steady state concentration - If we admin. drug by IV solution, at what time will we reach (Cp)∞max ? At time 0 - In case of multiple dosing, we reach steady state condition due to the sufficient amount of times we admin. the dose - In EV route, (Cp)∞max occurs when time is tmax (Cp)∞min always takes place when time is tau (for EV and IV), and tau is an interval Average conc.: max. and min. at steady state, so average steady state conc. is important because when you’re trying to find out dose to reach conc., so average conc. value we select will depend on the therapeutic range of that drug (use number in middle of therapeutic range) In multiple dosing kinetics: dosing interval (tau) will influence every equation |
|
|
Plasma Concentration vs. Time Following Administration of Many Doses |
Attainment of steady state condition following the administration of many doses (n > 7) of a drug Dosing interval: 12h - So every 12h, it becomes your time 0 for each additional dose |
|
|
Dost Ratio (r) |
This ratio permits determination of the amount and/or plasma concentration of a drug in the body at any time (t = 0 to t = tau) following administration of the n'th dose by IV and/or EV route r = (1 - e^-nRτ) / (1 - e^-Kτ) --- r: dost ratio --- n: number of administered doses (from 1 to ∞) --- K: elimination rate constant (1/hr) This ratio allows us to transform a single dose equation into multiple dosing equation -r: dost ratio -n: number of doses (can be any number, but generally after 8 – 9 doses, it becomes close to 0) |
|
|
Plasma Concentration vs. Time Profile Following the Administration of the First Dose of an IV Solution |
|
|
|
Dost Ratio Insertion into IV Bolus Equations -- Amount |
(Xn)t = [(X0(1 - e^-nKτ)) / (1 - e^-Kτ)] e^-Kt - X0 = administered dose (mg) - n = n'th dose - K = elimination rate constant (1/hr) - τ = dosing interval (hr, or # of half-life) - t = time (t > 0 and t < τ) following administration of the dose (hr) - This equation permits determination of amount of a drug in the body at any time, t, following the administration of n'th dose. Allows you to get amount of drug after n doses. Ex. 3h after dosing interval If n is 1, then Xnt = X0e^-Kt At time 0, e^-Kt disappears and this will give you max amount of dose at the time interval |
|
|
Dost Ratio Insertion into IV Bolus Equations -- Concentration |
(Cp)n = [(Cp0(1 - e^-nKτ)) / (1 - e^-Kτ)] e^-Kt - Cp0 = initial plasma concentration (mg/mL) - n = n'th dose - K = elimination rate constant (1/hr) - τ = dosing interval (hr, or # of half-life) - t = time (t > 0 and t < τ) following administration of the dose (hr) Cp0 = Dose/V Cp0 = y-int. of conc. vs. time data Time is always between 0 and dosing interval |
|
|
e^-nkτ and e^-Kt when n = 1 |
n = 1 (first administered dose) - Equation will collapse into equation for single dose Cp = Cp0e^-Kt |
|
|
e^-nkτ and e^-Kt when n = ∞ |
n = ∞ (after administration of many doses) - Generally > 8 or 9 doses, the term (1 - e^-nkτ) will approach a value of 1, and therefore 'vanishes from the equation Cp = [Cp0 / (1 - e^-Kτ)] e^-Kt |
|
|
t > 0 and t < τ |
In multiple dosing kinetics t > 0 and t < τ (a value between dosing interval) - Ex. if a dose is administered every 8 h, time (t) values will be between 0 and 8; time 0 indicates time at which dose is administered and time 8h represents τ. - For subsequent doses, we start again from time = 0 to time equal τ. |
|
|
Example: Dosing interval = 6h |
Administration of number of identical doses at an identical interval (τ = 6h) |
|
|
Plasma concentration vs. time profile following administration of number of identical doses at an identical interval (τ = 6h) |
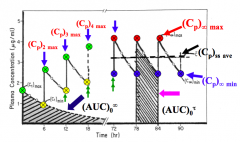
Once we reach steady state condition, Cp∞max and Cp∞min will be a fixed conc. value. As we increase number of doses, the max conc. and min conc. will be higher and the conc. will continue to increase until we reach steady state conc. (AUC)0∞ =Cp0/K (AUC)0∞ =Dose / Cls (AUC)0t : AUC when we reach steady state condition, and the value will be the same as (AUC) 0∞ - AUC for single dose from time 0 totime infinity, and AUC after we reach steady state condition from time 0 totime tau, will be exactly the same. |
|
|
Amount after n'th Dose Equation when t = 0 |
t = 0, e^-Kt = 1 and the plasma concentration at this time is the highest. (Xn)max = (X0(1 - e^-nKτ)) / (1 - e^-Kτ) (Xn)max: maximum amount of drug in the body following the administration of the n'th dose (ALWAYS when t = 0) This equation only applies at time0. -It allows u to get amount of drug after n dose -Max amount takes place when time is 0 This is max amount of drug in body following n’th dose. If we double the dose and everything else stays the same, Xnmax will double (directly proportional) If u want to calc. max amount after 2nd dose, 3rd dose, use eq. and change n. If n = 1, e-Kt terms cancel, and Xnmax =Xo. Xnmax after 1st dose = X0 for IV bolus |
|
|
Plasma Concentration after n'th Dose Equation when t = 0 |
(Cpn)max = (Cp0(1 - e^-nKτ)) / (1 - e^-Kτ) (Cpn)max: maximum plasma concentration of drug in the body following administration of the n'th dose (ALWAYS when t = 0) Dose adm. and dosing interval will affect amount of time we reach at a particular time. If we double dose, the amount of drug will be directly proportional if we keep everything else the same. If we keep the dose same, and we change dosing interval, you’re going to get diff. Xnmax value. So dosing interval also influences max. and min. amount or conc. |
|
|
Amount after n'th Dose Equation when t = τ |
When t = τ, the body will display the minimum amount (Xn)min (Xn)min = [(X0(1 - e^-nKτ)) / (1 - e^-Kτ)] e^-Kτ (Xn)min: minimum amount of drug in the body following the n'th dose (ALWAYS when t = τ) e^-Kτ for (Xn)min!!!!!! Difference between max and min equations: - This is e^-Ktau |
|
|
Plasma Concentration after n'th Dose Equation when t = τ |
(Cpn)min = [(Cp0(1 - e^-nKτ)) / (1 - e^-Kτ)] e^-Kτ (Cpn)min: minimum concentration of drug in the body following administration of the n'th dose (ALWAYS when t = τ). This is referred to as 'trough' plasma concentration. This is also e^-Ktau! |
|
|
How will the profile of (Cpn)max vs. Number of Administered Doses look like in RL paper? |
Increases asymptotically (plateaus) |
|
|
How will the profile of (Cpn)min vs. Number of Administered Doses look like in RL paper? |
Increases asymptotically (plateaus) (Cpn)min unit: mg/mL # of admin dose unit: mg |
|
|
How will the profile of (Cp∞)max vs. Number of Administered Doses look like in RL paper? |
Horizontal line |
|
|
How will the profile of (Cp∞)min vs. Number of Administered Doses look like in RL paper? |
Horizontal line |
|
|
Steady State Plasma Concentrations |
This condition is attained following the administration of many doses of a drug (i.e. n = ∞) - When n = ∞, the term (1 - e^-nKτ) becomes 1 When you go from n = 0 to n =∞, it becomes a small number that 1 – that is essentially = to 1. Cpnmax will be Cp∞max after admin many doses |
|
|
Equation of Amount of Drug in the Body at Steady State |
(Xn)∞ = [X0 / (1 - e^-Kτ)] e^-Kt (Xn)∞: amount of drug in the body at any time t (between t > 0 and t < τ) following the attainment of steady state. This occurs following administration of many doses. |
|
|
Equation of Concentration of Drug in the Body at Steady State |
(Cpn)∞ = [Cp0 / (1 - e^-Kτ)] e^-Kt (Cpn)∞: plasma concentration of drug in the body at any time t (between t > 0 and t < τ) following the attainment of steady state. This occurs following administration of many doses. Cp0 is the initial plasma concentration -- can be attained following administration of a single dose. Then we can predict steady state concentration at any time t. |
|
|
Maximum and Minimum Plasma Concentrations at Steady State Condition |
The maximum and minimum plasma concentrations at steady state will occur at t = 0 and t = τ,respectively, following the administration of many doses (i.e. n > 9) |
|
|
Steady State Plasma Maximum Concentration Equation |
(Cp)∞max or (Cp)max ss = Cp0 / (1 - e^-Kτ) (Cp)∞max or (Cp)max ss: maximum plasma concentration of a drug in the body at the steady state condition (following administration of many doses and at t = 0) |
|
|
What will influence Cp0 and Cp∞max? |
IV bolus: - Cp0 influenced by dose - So if we have higher dose, we have higher Cp0, and if everything else is the same, your Cp∞max or Cpmax ss will always be directly proportional to dose administered. - Dosing interval (τ) also influences it (τ has time unit), if τ is ∞, then e^-Kt will become 0, and 1 – 0 = 1, so Cp∞max at time ∞ = Cp0, so Cp∞max= Cp0 at this case. So if we don’t give 2nd dose at the correct time interval and we wait too long, then there will be no accumulation of drug in the blood and the graph will look the same as single IV bolus. So don’t give 2nd dose. Give 2nd dose for 10/15 half-lives, no drug in body so will get same type conc. as 1st dose. |
|
|
What happens if I administered drug at a dosing interval of 1 half-life of the drug? |
e^-Kτ becomes e^-.0693 = 0.5, soCp0/0.5 = 2Cp0 - So Cp∞max will be twice the Cp0 if we administer dose at dose interval of 1 half-life of the drug If admin at t=1 ½ life- 6 hr. so k will cancel and value will be e^-.693= .5 so 1-.5 is .5 so cp0/.5=2cp0. So Cp∞max will be twice the cp0 or 2x the cp1 max if admin at dosing interval=1 half life of the drug!!! Dosing interval influence Cp conc. you get even if admin dose in same, dosing interval influences cp∞max. if admin dose for 1 ½ life- if decide to admin sooner than 1 ½ life, admin at 3 hr which is ½ the half life, the cp∞max will be higher than if admin at 1 12/. -- Cp influenced by dose and dosing interval. SOONER ADMIN DRUG/MORE FREQUENTLY, THE CP∞MAX WILL BE HIGHER EVEN IF DOSE IS SAME. B/C DRUG ACCUMULATION FACTOR. Admin sooner, conc. from previous dose higher and adding same dose so cp∞max will be higher.- Need to know cp0 to use this- dose/v or graph for iv blouse and extrapolate intercept. - If want to give same dose- same cp0, and change dosing interval- you use new tau to calc cp∞max. if dosing interval=1 ½ life regardless of drug, subject- WHEN DOSING INTERVAL TAU= 1 ½ LIFE OF DURG, CP∞MAX WILL ALWAYS BE 2X CP0 OR CP1MAX. - More frequently admin dose, will give you higher cp∞max value. If admin at time infinity- Cp∞max will be cp0 same as cp1 max. -Longer dosing interval, the smaller cp∞max value. Shorter dosing interval, the higher the cp∞max value. |
|
|
Dosing interval influences plasma concentration at steady state |
So dosing interval will influence the plasma concentration we get at steady state, even if the dose is the same, the interval is still influencing Cp∞max. Cp∞max is influenced by two factors: dose adm., and the dosing interval we choose to admin the drug - The more frequently we admin drug, the Cp∞max will be higher even if the admin dose is the same – this is due to accumulation of drug in the body. Means if we admin drug sooner, the conc. is higher, and Cp∞max is higher - If admin. at time ∞, the conc. is same as Cp0 If I admin. dose much more frequently (smaller dosing interval), same dose will give higher Cp∞max,because we are admin drug more frequently – this is drug accumulation (unique to multiple dosing). Drug accumulation is a function of dosing interval.If admin. drug more frequently, you have higher amount of drug in blood (accumulation with previous dose) Dosing interval influence Cp conc. you get even if admin dose in same, dosing interval influences cp∞max. if admin dose for 1 ½ life- if decide to admin sooner than 1 ½ life, admin at 3 hr which is ½ the half life, the cp∞max will be higher than if admin at 1 12/. -- Cp influenced by dose and dosing interval. SOONER ADMIN DRUG/MORE FREQUENTLY, THE CP∞MAX WILL BE HIGHER EVEN IF DOSE IS SAME. B/C DRUG ACCUMULATION FACTOR. Admin sooner, conc. from previous dose higher and adding same dose so cp∞max will be higher.- Need to know cp0 to use this- dose/v or graph for iv blouse and extrapolate intercept. - If want to give same dose- same cp0, and change dosing interval- you use new tau to calc cp∞max. if dosing interval=1 ½ life regardless of drug, subject- WHEN DOSING INTERVAL TAU= 1 ½ LIFE OF DRUG, CP∞MAX WILL ALWAYS BE 2X CP0 OR CP1MAX. - More frequently admin dose, will give you higher cp∞max value. If admin at time infinity- Cp∞max will be cp0 same as cp1 max. -Longer dosing interval, the smaller cp∞max value. Shorter dosing interval, the higher the cp∞max value. |
|
|
What happens if dosing interval is 2, 3, 4 half-lives of the drug? |
The longer the dosing interval, the lower the Cp∞max value - the smallest value you can get is Cp0, not 0! The shorter the dosing interval, the higher the Cp∞max value. -Longer dosing interval, the smaller cp∞max value. Shorter dosing interval, the higher the cp∞max value. |
|
|
How will the profile of (Cp∞)max vs. Administered Dose look like? |
Directly proportional Cp∞max = Cp0/(1-e^-Kτ) Cp∞max CANNOT be zero!! Can't touch axis |
|
|
How will the profile of (Cp∞)max vs. Dosing Interval (τ) look like? |
Decreases nonlinearly (Hockey stick) Cp∞max = Cp0/(1-e^-Kτ) |
|
|
"Trough" Steady State Plasma Concentration Equation |
(Cp)∞min or (Cp)min ss = [Cp0 / (1-e^-Kτ)]e^-Kτ OR (Cp)∞min or (Cp)min ss = [(Cp)∞max]e^-Kτ (Cp)∞min: minimum or 'trough' plasma concentration of a drug in the body at the steady state condition (following administration of many doses and at t = τ) ‘trough’ plasma conc. is same thing as Cp∞min This is different from Cp∞max: e-Ktau -Here, we are interested in determining min. conc. at steady state conc. Directly proportional relationship: Cp∞min and Cp0 -Dosing interval also influences Cp∞min -So if we have long dosing interval, Cp∞min will be low value – the lowest Cp∞min we can get is 0 Cp∞min= (Cp)∞max .e^-Kτ and Cp = (Cp)0^e-Kτ are same mathematically -Difference is y-int -For IV bolus, int. is Cp0 -For multiple dosing, int. is Cp∞max |
|
|
How will the graph look like for (Cp)∞min vs. Administered Dose in RL paper? |
Directly proportional (Cp)∞min= [(Cp)∞max]e^-Kτ Cp∞min can be zero! Can touch axis |
|
|
How will the graph look like for (Cp)∞min vs. Dosing Interval in RL paper? |
Decreases nonlinearly (Hockey stick) This would be straight line down in SL paper. (Cp)∞min= [(Cp)∞max]e^-Kτ Cp∞min can be zero! Can touch axis |
|
|
How will the graph look like for (Cp)∞min vs. Time in RL paper? |
Decreases nonlinearly (looks like as single IV bolus dose graph) Difference the meaning of intercept |
|
|
These Equations are for Multiple Dosing of IV Bolus!! |
(Cp)∞max or (Cp)max ss = Cp0 / (1 - e^-Kτ) (Cp)∞min or (Cp)min ss = [Cp0 / (1 - e^-Kτ)]e^-Kτ (Cp)∞min or (Cp)min ss = [Cp∞max]e^-Kτ These equations are important in multiple dosing following the administration of a drug as an IV bolus dose. - We can determine maximum plasma concentration at steady state. The steady state peak plasma concentration influenced by the initial concentration (Cp0), elimination rate constant (K), and the dosing interval (τ) - Since the administered dose is identical and elimination rate constant is constant in a given patient, the peak plasma concentration at steady state is influenced only by the dosing interval (τ). - Dosing interval (τ) and initial plasma concentration play an important role in determining 'trough' plasma concentrations. |
|
|
More frequent administration of drug at steady state |
The more frequent (smaller dosing interval, τ) administration of an identical dose will result in higher peak plasma concentration at steady state. Minimum concentration at steady state will also be higher if you administer drug more frequently or if dosing interval is smaller. All concentrations are influenced by dosing interval (dose average, max, min) |
|
|
Less frequent administration of drug at steady state |
Less frequent administration (τ or dosing interval is large) will yield lower peak plasma concentration at steady state. |
|
|
Multiple Dosing - Extravascular Routes of Drug Administration - Oral Administration |
The vast majority of drugs administered on a continuous basis, are administered orally. Of these, a significant fraction yield plasma drug concentration-time profile which can be described by a one compartment model with first order absorption and elimination. |
|
|
Multiple Dosing: EV Route Equation |
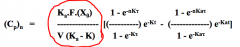
- (Cp)n = plasma concentration at time t following the n'th dose - t = time from t > 0 and t < τ during dosing interval - Ka = absorption rate constant - F(X0) = fraction of administered dose Circled term is y-int. of conc. vs. time profile. Concentration at any time t (t is between dosing interval) If I administer first dose only, then n = 1, and equation is same as single dose equation. |
|

From this equation we can predict... |
Equation can predict plasma concentration of a drug at any time (t) during the dosing interval (τ). - Knowledge of parameters F, V, and Ka, intercept of plasma concentration vs. time profile for a single dose, and K is essential to make such predictions. - We know that for EV administered drug, the peak plasma concentration will occur at peak time and the minimum or ‘trough’ plasma concentration will occur at t = τ. - Therefore, it's essential to know the peak time and the dosing interval (τ) fora given dosage regimen. EV route: At time 0, there's nothing in the blood, so Cp0 is 0. |
|
|
Peak Time in Multiple Dosing (t'max) |
Assuming that the fraction (F) of each dose absorbed is constant during a multiple dosing regimen, the time at which a maximum plasma concentration of drug at steady state occurs |
|
|
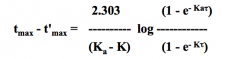
Peak Time in Multiple Dosing (t'max) equation [DON'T MEMORIZE EQUATION] |
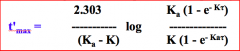
Peak time (tmax) following single EV dose is given by the equation: tmax = [ln(Ka/K)] / (Ka-K) |
|
|
Plasma Concentration vs. Time Plot Following Administration of Many Identical Doses of a Drug by EV Route |
Drug if admin drug by EV following principles of multiple dosing. t’max: green arrow (AUC)0∞ = (AUC)0t If we subtract tmax from t’max,we will get a positive value which tells you is that t’max value is always going to be smaller than tmax calculated for first dose of that particular drug. So if I admin. drug as single dose and calculate tmax, then take same drug and admin in multiple dosing basis and reach ss condition, and use equation, and t’max that we’ll get is going to be smaller than single dose. Issues: -How do I calc. t’max for 2nd and 3rd dose? We have calc. for when reach ss condition, but how do u calc. up until we reach ss -If t’max is going to be smaller than tmax for 1st dose of a drug, do I see that only when we admin many doses, and do we see the change coming after we admin each dose? |
|
|
t'max and tmax |
- Since the right side of this equation is always positive, it seems that the maximum plasma concentration occurs at an earlier time of steady state than following the administration of a single dose. - The time at which the maximum plasma concentration is observed following the first dose (i.e., tmax) is often the time at which the plasma is sampled after the administration of subsequent doses to assess (Cp)max. - Mathematical principle clearly suggests that this would not be a sound practice since the time at which a maximum plasma concentration occurs is not constant until steady state is attained. |
|
|
Maximum or Peak Plasma Concentration at Steady State |
Once t'max is known, maximum plasma concentration at steady state (Cp)∞max can be calculated by.... (Cp)∞max = [F(X0)/V] x [1/(1-e^Kτ] e^-K.tmax (Cp)∞max = [(Ka - K)/Ka] (I) [1/(1-e^-Kτ] e^-K.tmax We can determine steady state peak plasma concentration for a drug administered EV provided we know the intercept value for an identical single dose, peak time (t'max), t1/2, Ka, and dosing interval. I: y-int. of plasma concentration-time data for administration of a single dose of the drug. |
|
|
Plasma Concentration vs. Time Plot in SL paper for EV Single Dose |
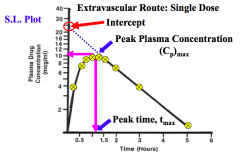
Information from single dose of a drug that is admin. from EV route - Can calc y-int, Ka,K, he will give t’max, and if he gives dosing interval we can get Cp∞max If I admin same dose of same drug by 2 diff EV route for same healthy subject, will Cp∞max will be the same or different? Depends on Ka, y-int,and all parameters that are subjected to changes by route of admin. -K wont’ change, but Ka may change – will reflect in Cp∞max of the drug -Ka depends heavily on dissolution of a drug, so if u have drug that doesn’t dissolve quickly, Ka will be very small value and will reflect on int. value |
|
|
Minimum or "Trough" Plasma Concentration at Steady State |
(Cp)∞min = [(Ka.F(X0))/V(Ka-K)] x [1/(1-e^Kτ] e^-Kτ (Cp)∞min = [Intercept/(1-e^-Kτ)] e^-Kτ IV bolus: y-int is Cp0. Here: y-int is (Ka.F(X0))/V(Ka-K) When we admin drug in multiple dosing basis, it is assumed that we admin subsequent doses in post absorption period. -let’s say peak time for a single dose is 1 h, you won’t see the pt taking tablet before 1 h. We admin in 4h, so we assume that the conc. has gone beyond the peak conc. period Same tablet, same formulation, but dose is diff, the value of the y-int will be double, Cp∞max and Cp∞min will be directly proportional |
|
|
Concept of "Average" Plasma Concentration at Steady State, (Cp)ss for IV Bolus |
Note: term "average" is in the quotation mark and, therefore, signifies that it does not carry the same meaning as we know it. - Term signifies that plasma concentration value will be between the maximum (peak) and minimum concentrations (Trough) Average desired plasma conc. is always within the therapeutic range (effective conc. range). The average conc. value will always be between Cp∞max and Cp∞min |
|
|
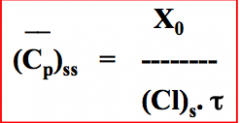
"Average" Plasma Concentration at Steady State Equation |
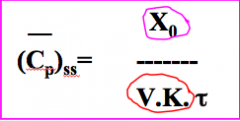
X0: administered dose (mg) V: apparent volume of distribution (mL) K: elimination rate constant (1/hr) τ: dosing interval (hr) What do I need to calc. average ss conc.? Admin dose, Cls, dosing interval Can I get Cls, V, and K by admin single dose of a drug? Yes If we double the dose in healthy pt,Cpss will double. If I keep dose same, but admin dose more frequently, Cpss will increase. Cls influences Cpss. Cls changes in renal impairment. So if Cls decreases in renal impairment, Cpss will be high even if we keep same dose and same time interval. If I give 800mg ibuprofen every 8 hrs,and if I give 400mg every 4 hrs,will dose interval change? Ratio doesn’t change, so average ss conc. won’t change. -Change will take place in Cp∞max,and Cp∞min -So ratio of dose/dosing interval won’t change, but Cp∞max and Cp∞min will change. It's better to give smaller dose more frequently, than larger doses less frequently. |
|
|
Another "Average" Plasma Concentration at Steady State Equation |
X0: administered dose (mg) Cls: systemic clearance (mL/hr) τ: dosing interval (hr) If Cls changes: Greater degree of impairment, the smaller Cls, the greater the Cpss. -So what choice do we have? We can change the dose or change the dosing interval,or do both |
|
|
"Average" Plasma Concentration at Steady State Equations Indicate... |
Equations indicate that knowing apparent volume of distribution (V), elimination rate constant (K) of a drug or systemic clearance of a drug (obtained from a single I.V. bolus), the ‘average’ plasma concentration of a drug at steady state, following the IV administration of a fixed dose (X0) at a constant interval of τ, can be predicted. - Furthermore, it is also clear that only the size of the dose administered and the dosing interval (τ) maybe adjusted to obtain desired ‘average’ steady state plasma concentration since V, K, and systemic clearance (Cl)s are constant for a given drug. |
|
|
What will the profile of average (Cp)ss vs. administered dose look like in RL paper? |
Directly proportional Cp avess = X0/(Cls.τ) For both IV and EV routes. |
|
|
What will the profile of average (Cp)ss vs. clearance (Cls) look like in RL paper? |
Declining nonlinearly (Hockey stick) Cp avess = X0/(Cls.τ) For both IV and EV routes |
|
|
What will the profile of average (Cp)ss vs. dosing interval look like in RL paper? |
Declining nonlinearly (Hockey stick) Cp avess = X0/(Cls.τ) |
|
|
What will the profile of average (Cp)ss vs. Ratio (X0/Cls.τ) look like in RL paper? |
Directly proportional For both IV and EV routes |
|
|
Average (Cp)ss is influenced by... |
- The proximity between the ‘average’ plasma concentration and the peak and ‘trough’ steady state concentrations is solely influenced by the chosen dosing interval (τ). - The smaller the dosing interval (t), greater will be the proximity between the ‘average’ and maximum and minimum plasma concentrations. As u begin to give drug more frequently (dosing interval is small), u will see average conc. be in middle of the range.If u admin more frequently, Cp∞max and Cp∞min will be close to each other |
|
|
Average (Cp)ss and (AUC)0∞ For IV Bolus |
Area under the plasma concentration-time curve during a dosing interval (τ)at steady state (AUC)0τ is equivalent to total area under the curve following a single dose [(AUC)0τ = (AUC)0∞] So AUC from time 0 time τ (ONLY AT SS) will be exactly same from AUC from time 0 to time infinity of single dose. |
|
|
Average (Cp)ss and (AUC)0∞ Equation for IV Bolus
|
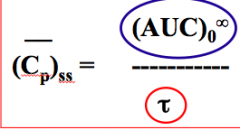
(AUC)0∞ = Cp0/K from a single dose Average’ steady state plasma concentration is influenced by dosing interval (τ) and (AUC)0∞ AUC value is influenced by dose admin. (Directly proportional) If pt has renal impairment, K will be smaller, so AUC will be larger, and Cpss will be larger.If I give drug more frequently, Cpss will be higher. Once u know AUC value, u can calc Cpss |
|
|
How will the profile for average (Cp)ss vs. (AUC)0∞ look like in RL paper? |
Directly proportional (Cp)avess = (AUC)0∞ / τ For both IV bolus and EV route |
|
|
How will the profile for average (Cp)ss vs. dosing interval look like in RL paper? |
Declining nonlinearly (Hockey stick) (Cp)avess = (AUC)0∞ / τ For both IV bolus and EV route |
|
|
How will the profile for average (Cp)ss vs. Dose/τ look like in RL paper? |
Directly proportional Slope = Cls |
|
|
"Average" Plasma Concentration at Steady State, (Cp)ss for EV Route |
Circled F: absolute bioavailability If drug is completely absorbed (F=1), this equation will collapse to IV bolus equation. Any factor that will influence F will also influence Cpss value. Will route of admin, formulation, dosage form influence F? Yes There’s no guarantee that F will be the same, even if dose is same in two diff formulations. We can determine absolute bioavailability of drug as long as we admin drug in same dose interval, and we know Cpss value. If Cpss value is identical for IV bolus and EV route, then we can say that F = 1. If Cpss value that is exact same following admin of same dose by IV and EV route, we can say that drug is completely bioavailable. If not, it will affect AUC value and Cpss value. |
|

|
‘Average’ plasma concentration, (Cp)ss, is dependent on size of dose administered (X0), fraction of dose reaching general circulation (F) or absolute bioavailability, and dosing interval (τ). - ‘Average’ dose (X0) is administered as single dose every τ time unit or is subdivided and administered at different times within τ time unit. (i.e. 600mg once/day is equivalent to 300mg q12h is equivalent to 150mg q6h. However, upon subdividing the dose, difference between steady state maximum and steady state minimum plasma concentration will usually decrease. Dose/tau: 600mg/24hr or 300mg/12 hr -Ratio doesn't change, so average steady state conc. will be exactly the same -Advantage: Cp∞max and Cp∞min is also influenced by dosing interval, and if we admin smaller doses more frequently, the difference between Cp∞max and Cp∞mix will become smaller. Cp∞max and Cp∞min will be much larger if we admin larger dose less frequently. |
|
|
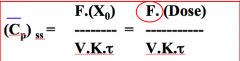
Difference between IV and EV "average" Cpss equations |
The difference between IV solutions and EV route equations is the incorporation of the term F, the absolute bioavailability of a drug. - Should the drug be completely absorbed (F = 1) following the extravascular administration, the equations will be identical Average (Cp)ss = F(X0) / Cls.τ |
|
|
Average (Cp)ss and (AUC)0∞ For EV Route |

Equation is more useful for predicting the ‘average’, (Cp)ss ,since the AUC, following a single dose, is generally easily determined. Furthermore, estimates of F and V are not required for this method. Same equation as for IV bolus, only difference is value of AUC is a function of F(Dose), it F = 1 then numerical value will be same as IV bolus, if F < 1 then numerical value will be smaller than it would be in IV bolus. |
|
|
Average (Cp)ss vs. (AUC)0∞ for EV Route |
Directly proportional If u change dosing interval: if u have large dosing interval, average conc. will be smaller |
|
|
"Average" Steady State Concentration -- Important Comments |
- ‘Average’ plasma concentration at steady state is influenced by dose administered (X0), fraction of administered dose that reaches general circulation (F), systemic clearance(Cl)s,and dosing interval (τ) - In normal subjects, Cls is constant and presumed to be independent of route of drug administration and dose administered. Consequently, Cls will not play a role in influencing the ‘average’ concentration. - ‘Average’ concentration is influenced by three factors: dose administered(X0),the absolute bioavailability(F), and the dosing interval(t) Cls is constant unless pt. has renal impairment F comes into the particular if u admin drug by EV route If u change dosing interval – if u give dose more frequently, Cpss will be higher |
|
|
Designing or Establishing Dosage Regimen for a Drug |
- Know therapeutic range or effective concentration range for drug. - Select desired/targeted ‘average’ steady state plasma concentration (Cp)ss. It is a common practice to choose the mean of the therapeutic range of a drug as a starting desired ‘average’ steady state plasma concentration. For example, if the therapeutic range is 10 to 30 mg/L, choose 20 mg/L as the targeted ‘average’ steady state concentration. - Use the equation: Average (Cp)ss = X0/Cls.τ If I know the range, pick number in the middle of the range and use that as desired average ss plasma conc. You don’t want to choose 10mg/L in this example because there’s always variation, and we might get below MEC. |
|
|
Designing or Establishing Dosage Regimen for a Drug |
- Select the dosing interval (τ).It is safe and a good practice to start with τ = t1/2 of the drug. - Using that dosing interval (τ= t1/2), calculate the dose (X0) needed to attain the desired ‘average’ steady state. - Round off the number for calculated dose and chosen dosing interval. Ex. calculated dose is 109.25 mg may be rounded off to nearest whole number of the commercially available product (i.e. 100 or 125 mg), which ever is more practical. And the half life of 4.25 hrs. may be rounded off to 4 hours. - Using rounded numbers for the dose (X0) and dosing interval (τ), calculate ‘average’ steady state concentration (Cp)ss, peak steady state concentration [(Cp)∞max] and ‘trough’, steady state concentration [(Cp)∞min]. |
|
|
Designing or Establishing Dosage Regimen for a Drug |
- Make sure that the calculated peak steady state concentration is below MTC and calculated ‘trough’ steady state concentration is above MEC. - If necessary, make small adjustments (‘fine tuning’) in the dose (X0) and dosing interval (τ). - While designing optimum & practical dosage regimen for EV drug, the approach and steps involved are identical; it is important to take into consideration the absolute bioavailability (F) of the drug, which may vary depending upon the dosage form, route of administration, and the formulation. Once we get Cp∞max and Cp∞min,we can do some fine tuning: we can change the dosing interval to maintain the Cp within the therapeutic range. For EV route: must know F of a drug. |
|
|
Drug Accumulation (R) for IV Bolus |
Administration of a drug on a multiple dose regimen will result in accumulation of drug in the body. It is one of the indelible characteristics that accompany multiple dosing of drugs. The extent of accumulation of a drug may be quantified in several ways. Drug accumulation will be present if u admin drug on principles of multiple dosing, also drug fluctuation will be there. There’s a rising conc. of drug in the body as we admin drug more frequently. Max ss conc,average ss conc,min ss conc– all compared to the first dose of the same drug Drug accumulation: NO UNIT |
|
|
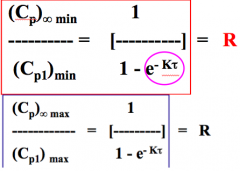
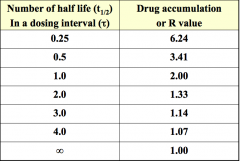
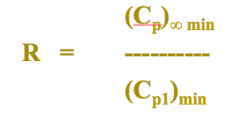
Drug Accumulation (R) for IV Bolus Equation |
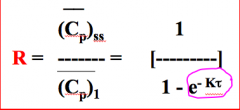
If I double dose, Cp1 will also be higher, Cpss will also be higher, therefore the ratio won’t change. Dose won’t influence drug accumulation factor. K is constant. Dosing interval (tau) plays an important role in determining accumulation factor. So if we need to calc drug accumulation factor, we need to know Cp1, Cpss. If I know dosing interval and half-life, we can calc. accumulation factor. If tau = 1 half-life of a drug, then R (accumulation factor) = 2 -Average ss conc. is going to be twice the average conc. following the admin of the first dose (solely influenced by dosing interval) So if I use Cp∞max, we must know Cp1max. |
|
|
From the knowledge of peak and 'trough' steady state plasma concentrations |
- Other ratios: peak plasma concentration at steady state (Cp)∞max and peak plasma concentration following administration of first dose (Cp)1max and ‘trough’ concentration at steady state (Cp)∞min and ‘trough’ concentration following administration of first dose (Cp)1min may also be employed to measure the extent of drug accumulation (R). If we use Cp∞min, we must know Cp1min to get the ratio. (key: conc. following admin of first dose) |
|
|
(Cp)1min and (Cp)1max Equations for an IV Dose |
(Cp)1min = Cp0.e^-Kτ (Cp)1max = Cp0 Remember for Cp∞min and Cp∞max: Cp∞min = [Cp0(1-e^-Kτ)]e^-Kτ Cp∞max = Cp0/(1-e^-Kτ) |
|
|
Ratio of (Cp)∞min to (Cp)1min -- AND -- (Cp)∞max to (Cp)1max yields... |
A comparison of ‘average’, minimum, and maximum plasma concentrations of a drug following the administration of the first dose and at steady state enables one to gain an insight into the extent to which a drug would be expected to accumulate on multiple dosing. |
|
|
Important Comments on Drug Accumulation (R) |
- Administration of drug on a multiple dose regimen will result in accumulation of drug in the body. - Drug accumulation is an indelible and salient feature of multiple dosing PK. - The numerical value for drug accumulation (R), either calculated or reported, indicates how high the plasma concentration will be, at steady state, compared to the first dose of the drug at a time, for the chosen dosage regimen. If I say accumulation factor is 2,or 1.75, or 3.5. What does that mean? Means that Cp∞max will be twice the Cp1max (NO EXCEPTION!) If I admin drug more frequently,then accumulation factor will be higher because Cp∞max will be higher. |
|
|
Drug Accumulation Example |
- Calculated or reported value of R = 2 simply suggests that the peak plasma concentration at steady state [(Cp)∞max]will be twice the peak plasma concentration for the first dose [(Cp)1max or (Cp)0]. - Analogously, the minimum plasma concentration at steady state [(Cp)∞min]will be two times higher than the minimum plasma concentration for the first dose [(Cp)1min). Or the ‘average’ plasma concentration at steady state will be twice the ‘average’ plasma concentration for the first dose. - This is applicable for an IV bolus dose of a drug. |
|
|
Drug Accumulation Depends on... |
Foran IV bolus dose: knowledge of calculated or reported R value permits one to predict the peak, ‘trough’, and ‘average’ plasma concentrations at steady state from the knowledge of maximum, minimum and ‘average’ plasma concentration for the first dose. - May also provide useful information about chosen dosing interval (τ) or frequency of dose administered. - The drug accumulation (R) solely depends on the dosing interval (τ) since the elimination rate constant (K) is a constant for a drug. - Quantification of drug accumulation requires knowledge of K of a drug and dosing interval (τ). τ can be measured in terms of the number (N) of elimination half-lives (t1/2) IfR = 2, that means they admin drug every 1 half life of the drug. Numerical value of R will also give u information of dosing interval. If R is > 2, then dosing interval is < 1 half-life of a drug Even if its’ renal impaired patient, dosing interval is 1 half-life, then R will still be 2. |
|
|
Drug Accumulation Example: If Drug has Elimination Half-Life of 24h |
K = 0.693/24h = 0.029/hr τ = 24 h (1 half-life of the drug) R = 1/ (1 - (e^-0.029/hr x 24h)) = 2 |
|
|
Drug Accumulation Example: If dose is administered more frequently (every 6 h) |
If drug is administered every 6h, τ = 6h, 0.25 half-life of the drug, there will be greater accumulation of the drug: R = 1/ (1 - (e^-0.029/hr x 6h)) = 6.25 If I give same dose of same drug every 1/4th half-life of drug, Cp1min, Cp1max will be 6.25 times higher |
|
|
Table Illustrating Relationship Between Drug Accumulation (R) and Dosing Interval (τ) |
Plot R vs. τ: Decreases nonlinearly (Hockey stick). Lowest value you can get is 1 - If accumulation factor is 1, means there's no accumulation, you get 1 when time is ∞. Q1/Q2 vs. # of elimination half-lives – 1st infusion rate was greater by a factor of 2 -Compare to this table (Here, R is 2 when dosing interval is after 1 half-life of a drug) |
|
|
How will the graph look like: Drug accumulation (R) vs. administered dose |
Horizontal line Dose has NO influence on R value R = 1/(1-e^-Kτ) |
|
|
How will the graph look like: Drug accumulation (R) vs. dosing interval (τ) |
Decreases nonlinearly (Hockey stick) When t = ∞, R = 1 - The lower the accumulation factor, the longer the dosing interval - The higher the accumulation factor, the shorted the dosing interval R = 1/(1-e^-Kτ) |
|
|
Determination of Drug Accumulation (R) in EV Routes |
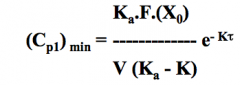
Compare min plasma conc. of drug at steady state, (Cp)∞min, following 1st dose, (Cp)1min. Note: This equation only applied when each successive dose is administered in the post-absorptive phase of the preceding dose. This expression can be readily employed to determine extent of accumulation (R) following EV administration of a drug as long as dosing interval (τ)and the elimination rate constant (K) of the drug are available. |
|
|
R if drug is slowly absorbed |
This situation (previous flashcard) exists for large number of drugs although it may not be valid for sustained release products and for drugs which are very slowly absorbed (How do we know if a drug is slowly absorbed?). If drug is very slowly absorbed: Rate of absorption is very slow, which parameters do we use to assess rate of absorption? Tmax and Cpmax What will influence tmax? Ka value (If Ka is small, Ka and K difference is small, and tmax is long) |
|
|
(Cp)1min equation for EV route |
|
|
|
(Cp)∞min equation for EV route |
|
|
|
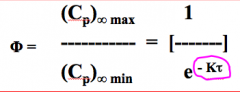
Determination of Fluctuation (Φ) |
- Fluctuation (Φ) is simply a measure of the magnitude of variation or the differences between the peak and the ‘trough’ concentrations at steady state or the peak and ‘average’ plasma concentrations at steady state. - Fluctuation (Φ) is simply a measure of the ratio of the steady state peak (Cp)∞max over the steady state minimum or ‘trough’ concentrations or the ratio of (Cp)∞max over the ‘average’ steady state concentration for the chosen dosage regimen. Fluctuation is the opposite of accumulation. Fluctuation and accumulation are always present multiple dosing kinetics. We are looking at how close or far these numbers are to each other (peak conc. at ss, and trough conc. at ss). If numbers of close to each other, then fluctuation is small. What influences fluctuation is dosing interval. Cp∞max / Cp∞min =This number will tell u how close or far away these values are (no units) |
|
|
Determination of Fluctuation (Φ) for IV Bolus |
Diff between accumulation and fluctuation equation: -Drug accumulation: 1 – e^kt -Drug fluctuation: e^kt- What happens for a drug is K is constant, so what influences fluctuation and accumulation is dosing interval. |
|
|
If dosing interval is expressed as terms of number of elimination half-lives (N), then Φ... |
N = τ/t1/2 K = 0.693/t1/2 τ = (N x 0.693)/K Φ = [(Cp∞max)/(Cp∞min)] = 1/(e^-0.693.N) If N = 1, (we admin drug in dose interval = 1 half-life of a drug), equation becomes Cpmaxss/Cpminss= 2 -Means Cp∞max will be twice Cp∞min If N = 0, and Cp∞max/Cp∞min= 1 |
|
|
Fluctuation (Φ) depends on... |
- Observed/calculated fluctuation (Φ) for chosen dosage regimen depends solely on chosen dosing interval (τ). And it is expressed by a numerical value. - When N is small (more frequent dosing), the smaller is the range of drug concentrations (difference between the max and min plasma concentrations will be smaller). - Hence, frequent dosing (smaller dose administered more frequently) is preferred for steady state condition over less frequent administration of larger doses in order to avoid toxicity problem. Drug accumulation factor and drug fluctuation factor have no units. IfCp∞max and Cp∞min are the same, then ratio is 1, and this can’t happen because we are not giving the drug continuously. More frequent admin of drug will result in lower fluctuation, and will give u Cp∞max values and Cp∞min values closer to each other. Toxicity problem: Large doses less frequently – Cp∞max could be above MTC and Cp∞min could be below MEC |
|
|
Table Illustrating Relationship Between Drug Fluctuation (Φ) and Dosing Interval (τ) |
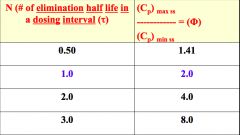
When dosing interval is = 1 half-life of a drug, the ratio of Cpmaxss/Cpminss will be 1.41. So, Cp∞max is1.41 times greater than the Cp∞min for that dosing interval. When dosing interval becomes larger, the diff of Cp∞max and Cp∞min becomes larger, so fluctuation is bigger in this dosage regimen if we admin drug less frequently. |
|
|
Plasma Concentration vs. Time Profile Following Administered Doses of Many Doses (n > 7) of a Drug |
Admin drug more frequently: Small fluctuation and greater accumulation -All values (Cp∞max and Cp∞min)should be close to each other – all values are within therapeutic range as long as patient continues to follow the correct directions |
|
|
Table Illustrating Relationship Between Dosing Interval, Drug Accumulation and Fluctuation |
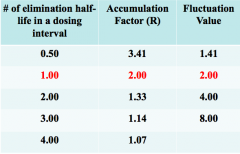
Note: R and Φ when τ = t1/2 of the drug. Dosing interval = 1 half-life of drug, accumulation and fluctuation numbers are 2. All other numbers are going in opposite directions. Lowest accumulation factor is 1 (means there’s no accumulation) when time is infinity. Lowest fluctuation value is when time is equal to zero, fluctuation value is 1. If you graph N vs. R and fluctuation: the graphs will only intersect at 2. |
|
|
What will the graph of fluctuation (Φ) vs. dosing interval (τ) look like in RL paper? |
Asymptotic (increases then plateaus) |
|
|
What will the graph of accumulation (R) vs. dosing interval (τ) look like in RL paper? |
Decreases nonlinearly (Hockey stick) |
|
|
Number (n) of Doses Required to Reach a Fraction of Steady State Condition: IV Bolus and EV Route |
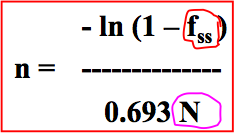
n = number of doses required to reach a given fraction of steady state (fss) condition N = number of elimination half-lives in a dosing interval In IV infusion: it’s the time (how long we infuse drug will take us to ss condition) - Time of infusion is important Multiple dosing: number of doses that is allowing us to reach ss condition -Number of doses becomes important If I want to reach 50% of ss,and we know dosing interval, we can calc. the number of doses needed to reach the ss in a dosing interval |
|
|
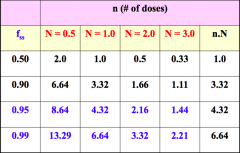
If dosing interval is 1/2 half-life of a drug, and I want to reach 50% of true ss conc. (fss =0.5), I would need 2 doses to reach this steady state conc. If u give drug more frequently..Let’s say we give 25mg/day, and we choose to give 12.5mg the dosing interval becomes every 12 hours, and if we change to every 4hours So we give smaller doses more frequently, the number of doses is generally higher. Advantage is drug accumulation is greater, drug fluctuation is smaller, and Cp∞max and Cp∞min values are smaller. |
|
|
Loading (DL) & Maintenance (DM) Doses for IV and EV Routes |
- It may take long time to reach the desired average drug concentration at steady state (Administration of 6 or 7 doses). Therefore, a loading dose (DL) maybe administered to obtain the steady state condition instantaneously. - The value of loading dose (DL) is such that, at time = τ, after its administration, the plasma concentration of drug is = (Cp)minss. Minimum ss conc. will be attained when time = tau following the admin of DL. |
|
|
Calculation of Loading (DL) & Maintenance (DM) Doses for IV and EV Routes |
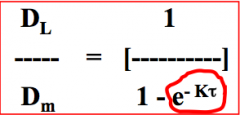
DL = loading dose (mg) DM = maintenance dose (mg) Compare with Wagner's equation: Q1/Q2= 1/1-e-Kt Ratio of loading dose over maintenance dose: dosing interval becomes important -Higher the ratio, higher the loading dose, but the maintenance dose won’t change |
|
|
Calculation of Loading (DL) & Maintenance (DM) Doses for IV and EV Routes -- When we substitute for τ = N.t1/2 |
DL/DM = 1/(1 - e^-0.693.N) - Equation gives ratio of loading dose (DL) to maintenance dose (DM) required to attain instantaneous steady state condition when there are N elimination half-lives in a dosing interval (τ). - Equation indicates: more frequent dosing (small N value), the larger is the loading dose (DL) compared to the maintenance dose (greater is the ratio of DL over DM) in order to attain instantaneous steady state condition. Ratio of loading dose and maintenance dose is influenced by frequency of how often we admin dose. |
|
|
Table Illustrating Relationship Between Ratios of Loading Dose (DL) to Maintenance Dose (DM) Required to Attain the Steady State Condition and the Dosing Interval (τ) |
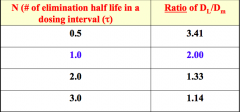
N vs. DL/DM ratio: Hockey stick When we give dose after 1 half-life of drug: Twice the loading dose compared to the maintenance dose Lowest value will be 1, we are saying that DL and DM are the same. |
|
|
Plot of administration of loading lose followed by maintenance dose & administration of only maintenance dose |
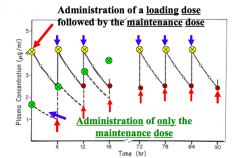
Steady state peak plasma concentration of a drug as a result of loading dose and no loading dose. If I admin drug by IV solution: -Yellow circles: dose we admin as a bolus dose (DL), then we follow by maintenance dose– so we reach ss condition instantaneously -Green: maintenance dose (individual doses, no loading dose) – eventually reaches ss condition after 7-8 doses Loading dose is almost twice as high as the maintenance dose (so we can say that use time interval of 1half-life of a drug) |
|
|
Calculation of Loading (DL) & Maintenance (DM) Doses for EV Route |
Same equation! - Important: we give maintenance dose in post-absorption period (look at peak time) In oral route: we admin 2nd dose, 3rd dose after post-absorption period, so the term circled disappears from the equation. |
|
|
Loading (DL) & Maintenance (DM) Doses for EV Route for IV and EV Routes When Dose is Increased |
Irrespective of the size of the initial dose, the steady state plasma concentration of drug ultimately attained will be same since steady state level is governed by the size of the maintenance dose (DM). IfI give loading dose and I have a higher ratio, my Cp∞max will be higher. But when I put patient in maintenance dose, all Cp∞max will be same. |
|
|
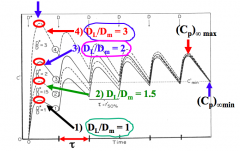
Attainment and then maintaining the steady state plasma concentrations by employing different ratios of loading dose (DL) over maintenance dose (DM) Oral route of admin. - When DL/DM = 1 when time is infinity - We get Cp1max, Cp2max, etc., and eventually we reach Cp∞max - DL/DM= 1.5, the loading dose is 1.5 times greater than maintenance dose, and Cp1max,Cp2max are higher until we reach Cp∞max,which is pretty similar to DL/DM =1 values - Cp1max we got when we have DL which is twice the maintenance dose (DL/DM = 2), is very similar to Cp∞max(this is why we admin this way, so we can reach ss faster) |
|
|
Maximum and Minimum Drug Concentration at Steady State |
For an IV bolus, the maximum concentration, (Cp)∞max, occurs at t = 0 after a dose at steady state, and the minimum concentration, (Cp)∞min,occurs at t = τ (i.e. one dosing interval after the dose is given) |
|
|
Cp∞max equations |
(Cp)∞max = (Cp)max ss = [X0/V] [e^-Kt/(1-e^-Kτ)] when t = 0, e^-Kt = 1 (Cp)∞max = (Cp)max ss = X0/[V(1-e^-Kτ)] |
|
|
Cp∞min equation |
when t = τ (Cp)∞min = (Cp)min ss = [X0.e^-Kτ] / [V(1-e^-Kτ)] |
|
|
Difference between (Cp)max ss and (Cp)min ss |
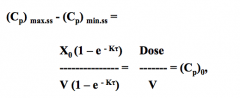
Where Cp0 is the peak plasma concentration following the administration of the first dose. At steady state, the difference between max and min concentrations or peak and ‘trough’ concentrations is equal to the initial plasma concentration or maximum plasma concentration following the administration of the first dose. No matter what the dose is, the diff between Cp∞max and Cp∞min will always be 0 when we reach ss condition |
|
|
Difference between (X)max ss and (X)min ss |
(X)max ss - (X)min ss = Dose = X0 At steady state condition, the amount or the mass of drug leaving the body during one dosing interval is equal to the administered dose. At ss: amount of drug leaving the body is same as amount of drug entering the body (this is when rates become equal) |
|
|
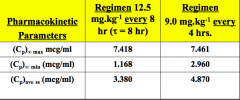
Procainamide is used for the treatment of ventricular tachyarrhythmias. It is administered IV as well as by other EV routes. It’s therapeutic range is 4 to 8 mcg/mL. The t1/2 and the V, in normal subjects, are reported to be 3 hrs. and 2 L/kg, respectively. |
Therapeutic range: 4 to 8 mcg/ml Elimination half life (t1/2):3.0 hrs Elimination rate constant (K): 0.231 hr-1 Apparent volume of distribution (V):2000ml/kg or 2.0 lit/kg Systemic clearance (Cl)s: 462ml/kg/hr or 0.462 L/kg/hr At ss,dosing interval makes the difference. If more frequently, fluctuation is smaller, accumulation is greater. At true ss condition: Cp∞max and Cp∞min = 0. |
|
|
Cp∞max, Cp∞min, and average Cpss are influenced by dosing interval -All conc. values are higher if we give smaller dose more frequently (9mg/kg q4h), this is due to drug accumulation |
|
|
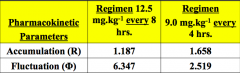
Accumulation is greater when we admin more frequently. Accumulation is smaller when we admin less frequently. Fluctuation is smaller when we admin more frequently. (Cp∞max and Cp∞min will be closer to average Cpss) Fluctuation is greater when we admin less frequently. |
|
|
Striking Differences Between Linear and Nonlinear Kinetics |
- Vmax and Km is strictly for nonlinear kinetics. Km is available for each drug that follows nonlinear kinetics. V, t1/2, K are all dependent on dose admin for nonlinear kinetics. Nonlinear kinetics becomes mixed kinetics depending on dose size. - Linear kinetics: independent of dose admin. |
|
|
Linear Kinetics |
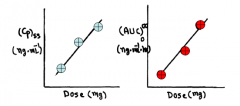
- The PK parameters (t1/2, K, V, and Cls) of most drugs are NOT expected to change when different doses are administered and/or when the drug is administered via different routes as a single or multiple doses. The kinetics of these drugs are described as linear pharmacokinetics or dose independent kinetics, and kinetics is characterized by the first order process. - The term linear simply means that plasma concentration at a time and area under the plasma concentration (AUC)0∞ will be directly proportional to the dose administered. |
|
|
Figures illustrating relationship between steady state plasma concentration vs. dose administered and (AUC)0∞ vs. dose administered when drugs exhibit linear kinetics (dose independent kinetics) |
|
|
|
Nonlinear Kinetics Example |
Forsome drugs, however, linear kinetics does not apply. -Ex. when the dose of Phenytoin(Dilantin) is increased by 50% in apatient from 300 mg/day to 450 mg/day, the average steady state plasma concentration (Cp)ssmay increase by as much as ten fold. - This dramatic increase in the concentration isdue to the non-linear kinetics ofphenytoin. This particular drug requirescertain enzymes to take drug from one place to another. If dose is high, itreaches saturation state because there’s more drug molecules than enzymes. How do I know this is nonlinear?Ex. Paxil – 10mg, 20mg, ,30mg, 40mg – look at Cpmaxvalues for each and if it’s linear kinetics, they should be increasing directlyproportional - If drug is increasing in aindirectly proportional manner, the Cpmaxvalues for each strength won’t increase linearly |
|
|
Figuresillustrating relationship between steady stateplasmaconcentration vs. dose administered and (AUC)0∞ vs. doseadministered when drugs exhibit non-linear Kinetics (dose dependent kinetics) |
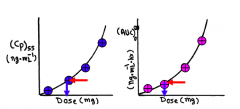
Nonlinear kinetics (different thanlinear kinetics) -Cpssor AUC vs. dose: graph increases in beginning, then there’s a dramatic increaseafter a certain value -Ifu look at the numbers up until the arrows – lower dose of the drug will havedirectly proportional relationship. But beyond this dose, conc. is greater thandouble (not directly proportional), this happens because of higher doses ofdrug |
|
|
Drugs That Exhibit Nonlinear Kinetics... |
- Fordrugs that exhibit nonlinear or dose dependent kinetics, PK parameters, such as Cls, V and the t1/2 may vary; depending on the administered dose. - This is because one or more of the kineticprocesses (absorption, distribution, and/or elimination) of the drug may beoccurring via a process other than simple first order kinetics. - For these drugs, therefore, the relationshipbetween the (AUC) or plasma concentration and the administered dose is NOT linear. Parameters such as V, t1/2, Cls, K,are all depending on size of dose admin to patient. This is active transport(not passive diffusion) in higher doses (in lower dose, it’s still passivediffusion). Keep in mind, that these are alltherapeutic doses of a drug that shows nonlinear kinetics. Kinetics of drug: absorption,distribution, metabolism and elimination. And there’s saturation somewherewhich contributes to the nonlinear kinetics of the drug. Some drugs where absorption issaturation, and in other drugs – metabolism is saturation phase, so it maydifferent for diff drugs. |
|
|
Nonlinear Kinetics -- Parallel Lines? |
- Administrationof different doses of these drugs may NOT result in parallel plasma concentration vs. time profiles expected for drugsthat exhibit linear pharmacokinetics. - Ex. for drugs with nonlinearmetabolism, the initial decline in the plasma concentrations may be slower athigher doses, compared with that after the administration of lower doses. Doesn’t give you parallel profileswhen you give high doses of a drug. Decline in conc. is diff in diff.conc. - Ex. If someone drinks too manycans of beers, and you reach saturation level and conc. of alcohol is high inblood – decline of conc. In blood is slow. But once conc. is low, declinebecomes rapid |
|
|
Plasma Concentration vs. Time Plot for Drugs that Follow First Order and Mixed Order Process in SL paper |
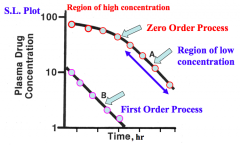
Conc. Vs. time - At lowdose: straight line, 1storder process - Same drug,but high dose: at the beginning, the line isn’t parallel to bottom line-Thisis mixed order process. In low conc., it behaves like 1st order process, and in high conc. it behaves like zero order process. |
|
|
Plasmaconcentration vs. time plots for adrugadministered IV and exhibitsthecharacteristics of a nonlinear kineticsinhigh doses. |
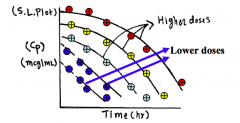
Profile between 1storder and zero order process in nonlinear kinetics. If I take 1 particular drug, and Igive a very low dose of the drug, then I increase the dose. Do you see thedifference in the conc. profiles for each dose? They’re no giving you straight line in higher doses. Which order process that the graphwill show depends on dose admin. In low doses, it shows first order, and in highdoses it shows zero order If all lines are parallel in everydose, then the drug follows 1storder kinetics If lines are NOT parallel in everydose, then drug follows nonlinear kinetics |
|
|
Nonlinear Kinetics: Rate of elimination and Plasma Concentration |
- Thismeans that the rate of elimination is NOT directly proportional to the plasma concentrationoradministered dose for these drugs. - The non-linearity may be at different kineticlevels of absorption, distribution and/or elimination. |
|
|
Plasmaconcentration vs. time plot foradrug that exhibits the characteristics of anon-linearPK in RL paper |
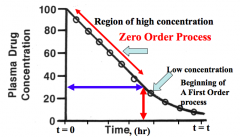
How will the graph look like in RLpaper when it follows mixed order process of nonlinear kinetics: - Atfirst (high conc.),it’s a straight line in RL paper – zero order process - Oncewe get to low conc. values, it becomes nonlinear line – first order process |
|
|
Figure illustrating relationshipbetween rateand the plasma concentration (Administered Dose)when the administered drug exhibits thecharacteristics of linear and non-linear kinetics. |
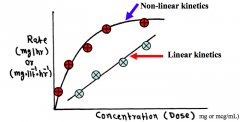
Striking diff between linear andnonlinear kinetics: - Rate(of absorption, of elimination, of metabolism, any rate) always directlyproportional in linear kinetics. If measure conc. values to describe change, It can have unit of mg/L/hr. - Topgraph is nonlinear kinetics, so if I measure diff rates, we get nonlinearprofile |
|
|
Michaelis-Menten: Rate of Drug Metabolism and Drug Concentration |
According to the principles of Michaelis-Mentenkinetic, the rate of drug metabolism (R) changes as a function of drug concentration |
|
|
Relationship between rate of metabolism and dose administered for a drug that exhibits nonlinear kinetics |
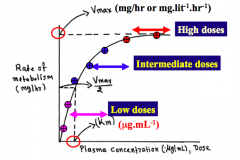
This graph is in RL paper - In nonlinear kinetics, we arelooking at RL paper – there are NO exponential terms (unlike in linearkinetics, which had lots of exponential term equations) Shows you 3 diff regions: rate ofmetabolism of a drug vs. admin diff doses of a drug, so concwill be different -Pink:low dose -Blue:intermediate dose -Green:high doses This graph tells you, that if wewant to calc doseof ss conc. for drug that follows nonlinear kinetics, we need to know Vmax and Km values. -Even if I admin drug in low doses and look at the values, all values inc. as we inc. dose. Increase appears to be almost directly proportional. At this region, inthis case, the conc. ofenzyme molecules is much greater than conc. of drug molecules (enough molecules to transport drug molecules – almost likepassive diffusion) -Wego to 2nd region, and rate inc. as we inc. dose, but it’s not directly proportional. This is the intermediate region -3rdregion, once I reach this level, no matter how high the dose is, the rate ofmetabolism won’t change, it has reached the max velocity of the rate for thisdrug regardless of dose admin beyond this point, and this is Vmax (maxvelocity, max rate – unit: mg/hr) -Kmalways has a unit of conc., and this Km is the conc. at which the velocity is half the max velocity (velocity of rate of metabolismin this case – could be any rate in another case). It’s Vmax/2. For every therapeutic agent thatfollows nonlinear kinetics, the Vmax and Km are reported in literature. Just like in linear kinetics, V, K,t1/2 is reported in literature |
|
|
Rate of Metabolism and Dose Administered Relationship... |
- Basedon this relationship, at very low drug concentration, theconcentration of available enzymes is much larger that the number of drugmolecules. - Therefore, when concentrationof drug is increased, the rate of metabolism is also increased proportionally(linear). However, after a certain point, as theconcentration increases, the rate of metabolism increases less thanproportional. Enzymes are present in the body, soat high doses of drug, the concis high and we don’t have sufficient molecules to carry drug molecules and weget saturation. So drug molecules sit there until enzymes are available totransport them. |
|
|
Rate of Metabolism and Dose Administered Relationship -- Saturation |
- The other extreme occurs when the concentration of drug is very high relative to the concentration of available enzyme molecules. - Underthis condition, all of the enzymes are saturated withthe drug molecules and when concentration is increased further, there will beno change in the rate of metabolism ofthe drug. In other words, the maximumrate of metabolism (Vmax) hasbeen achieved. |
|
|
Unit for Vmax |
The unit of Vmax isthe unit of elimination rate and normally expressed as amount/time (mg/hr). However, in some instances, it may beexpressed as concentration/time (mg/L/hr) |
|
|
Estimation of Michaelis-Menten Parameters (Vmax and Km) From a Single Dose Study -- Determination of Vmax and Km following administration of multiple doses |
Rate = Vmax - Km x (Rate/Cpss) Plot of Rate vs. Rate/Cpss will be linear with a slope = -Km, and intercept = Vmax We take 1 drug and admin a dailydose, and each dose will give us ssconc. and we use these values to get Vmax and Km. |
|
|
Plot of Rate vs. Rate/Cpss in RL paper |
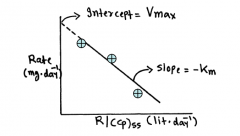
Determination of Vmax and Kmvalues following theadministration of three or four doses ofa drug 3 diff doses (the more points wehave, the more accurate) -Ex.20mg a day, 50mg a day, 100mg a day, and calcCpssvalue and plot rate vs. R/Cpss -Intercept:Vmax |
|
|
Estimating dosing rate from Michaelis-Menten Parameters |
- Ifthe Michaelis-Mentenparameters are known in a patient or are reported in the literature, one canestimate the dosing rate (R) necessary to obtain a desired (Cp)ss. - For example, for phenytoin, the estimatedvalue of Kmand Vmaxare 6.5 mg/L and548 mg/day,respectively. - It isdesired to obtain the steady state phenytoin plasma concentration of 15 mg/L.Determine the dosing rate. --- Dosing rate = (Vmax.Cpss)/(Km + Cpss) --- Dosing rate = (548 x 15)/(6.5 + 15) = 328.325mg/day We know Km and Vmax value, and byusing eq wecan calc whatwould be the Cpss fora given dosing rate, or which dosing date we need if we have a Cpssvalue. No exponential term in equationunlike 1storder process. Numerator: multiplication sign Denominator: Addition sign Every time u calcdose, u must use equation to calcdose we need in nonlinear kinetics!!!!!! |
|
|
Estimating Cpss from Michaelis-Menten Parameters |
Cpss = (Km x Ratio)/(Vmax - Ratio) Cpss = (6.5 x 400)/(548 - 400) = 17.56mg/L The administered doses of 100 mg/day, 200mg/day, 300 mg/day and450 mg/day,one can determine the steady state plasma concentration for each dose. I changed dose and I calc. Cpssfor each dose given. If we start 100mg a day for thedose, what will be the Cpss forthis dose? For each dose, we calc. Cpssvalue using the same equation. |
|
|
For 100mg/day, 200mg/day, 300mg/day, and 450mg/day.. The steady state plasma concentration for each dose |
- For 100 mg/day dose: Cpss = 1.45 mg/L - For 200 mg/day dose: Cpss = 3.73 mg/L - For 300 mg/day dose: Cpss = 7.86 mg/L - For 450 mg/day dose: Cpss = 29.84 mg/L |
|
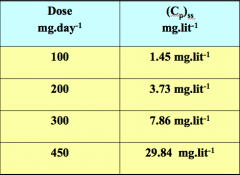
Construct the plot of Cpss vs. Administered Dose |
If this was linear kinetics, if Idoubled the dose, the conc. value would also double.BUT here, it’s nonlinear, the Cpssvalues are increasing with each dose but NOT in a directly proportional manner.Plot this graph and compare it tolinear kinetics profile. |
|
|
Relationship between AUC and Administered Dose for Single IV Bolus Dose |
(AUC)0∞ = Dose/VK |
|
|
Relationship between AUC and Administered Dose for drugs that follow nonlinear kinetics (capacity limited kinetics or Michaelis-Menten kinetics) -- For High Doses |
(AUC)0∞ = [Cp0/Vmax] [(Cp0/2) + Km] (AUC)0∞ = [X0^2 / (2 (Vmax.V^2))] At high doses or when Cp0 >> Km, the value of Km is 0 If we double the dose, the (AUC)0∞ goes up by 4 times; or tripling the dose will increase (AUC)0∞ by 9 times. - (AUC)0∞ is proportional to the square of the dose. Therefore, a relatively modest increase in dose may produce a dramatic increase in total (AUC)0∞. Athigh doses of a drug, Cp0 value is very high value, and the conc. Is muchgreater than Km value in high doses. And because of the great difference invalues, we ignore Km, and we modify the equation to: AUC = X02/2(Vmax).V2 athigh doses. If we double dose here, the AUC won’t double but will be 4 timesthe dose. If we give 3x the dose, my AUC value will be 9 times higher thandose. |
|
|
Relationship between AUC and Administered Dose for drugs that follow nonlinear kinetics (capacity limited kinetics or Michaelis-Menten kinetics) -- For Low Doses |
(AUC)0∞ = [Cp0/Vmax] [(Cp0/2) + Km] (AUC)0∞ = [Cp0 x Km] / Vmax At low doses or when Cp0 << Km or Cp0/2 << Km, the value of Cp0/2 is ignored because it's smaller than Km. - Vmax/Km = K; therefore, Km/Vmax = 1/K and Cp0 = Dose/V - So (AUC)0∞ = Dose/VK Atlow doses of a drug, Cp0 value is much smaller than Km, so Cp0/2 is ignored. SoKm is still in the equation, and the equation becomes (Cp0.Km)/Vmax. Vmax andKm are constants for a drug, so if we combine Vmax//Km = K, so equation becomesAUC = Dose/VK (Same as linear kinetics IV bolus). So at very low dose, andremain in this dose range, the drug will show directly proportionalrelationship between Cp andAUC. |
|
|
Ex. Phenytoin reported values of V and Vmaxare 50 liters and 548 mg.day-1,respectively. Determine the (AUC)0∞ following the administration of 100 mg, 200 mg, 300 mg and 450 mg doseof phenytoin. |
Vmax = 548/50 = 10.96mg/L/day (AUC)0∞ = [(Dose)^2] / [2(Vmax)(V^2)] For 100mg dose: (AUC)0∞ = [(100)^2] / [2(10.96)(50^2)] = 0.182mg/L/day For 200mg dose: (AUC)0∞ = 0.7299 mg/L/day For 300mg dose: (AUC)0∞ = 1.642 mg/L/day For 450mg dose: (AUC)0∞ = 3.695 mg/L/day Plot AUC vs. dose and make observation of relationship |