![]()
![]()
![]()
Use LEFT and RIGHT arrow keys to navigate between flashcards;
Use UP and DOWN arrow keys to flip the card;
H to show hint;
A reads text to speech;
31 Cards in this Set
- Front
- Back
|
World IMR stats |
1. World average is 44 per 1000 2. Angola is 178 (highest) 3. Sweden is 2 (lowest) |
|
|
World Life Expectancy stats |
1. Under 45 in sub-Saharan Africa 2. Over 80 in MEDCs (Australia, Japan, Canada) |
|
|
World Calorie Intake stats |
1. 1500 in Afghanistan and Eritrea (LEDCs) 2. 3000 and 2500 in China and India respectively (NICs) 3. 3700 in USA, Portugal, Greece (MEDCs) |
|
|
India & HYV |
Total population 1.3 billion by 2020. Food production increase by 50% to meet demand. 55% of crops are HYV Feeds twice as many people as Africa on just 13% of land area |
|
|
World hygiene stats |
WHO African region - Use of toilets 30% in 1990 to only 34% to 2008 Lowest increase in the world |
|
|
Environmental cost of Green Revolution |
Mismanagement of irrigation causes salination - 20% Pakistan land affected - 25% Central Asia |
|
|
Biofuel production in the US |
30% of corn crop diverted to biofuel production |
|
|
World agricultural funding stats
|
<5% government budget in African countries 20% of foreign aid for LEDC agriculture in 1986 <3% of foreign aid by 2006 |
|
|
Ethiopia general stats |
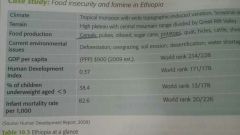
- 6.2 million need food aid - 82.6 infant mortality rate - 40% of children underweight - 2,1000 average calorie intake (daily requirement) |
|
|
Food deficiency due to climate in Ethiopia |
- Kirmet wet season - 90% of rain falls - 2008 & 2009 consecutive failure - Only 3% of cultivated land under irrigation (40% in Asia) - Food reserves used up |
|
|
Food deficiency due to land degradation in Ethiopia |
- 28% land degraded or severely degraded (FAO) - 40 sheep grazing 0.1 hectare land - Up to 100 tonnes upland topsoil eroded each year - Average only 4kg fertilizer per African farmer - 110kg in Asia per year |
|
|
Food deficiency due to population growth |
- Population doubled in 25 years (Malthusian increase) - 100% increase maize price (WFP) - 40% increase wheat price in 2008 |
|
|
Economic importance of agriculture in Ethiopia |
- Primary Industrial Sector - 50% of GDP - 80% employment - 85% of exports - 35% of foreign earnings from coffee exports - Down from 65% a decade ago (stumped coffee price) |
|
|
Implications of Trading Blocs / Farm subsidies |
- Common Agricultural Policy by EU - Guarantees food prices for unlimited production - Surplus from 'Food mountains' undercut farmers outside EU - Farmers lose $100 billion per year |
|
|
Implications of multilateral / bilateral agreements |
Multi (failure) - 1975 Lome Trade Convention - ACP (African, Caribbean & Pacific nations) preferential access to EU - Only 7% of EU banana imports from Caribbean Bi (success) - Sainsbury bananas all fair traded since 2007 - 100 million from St. Lucia |
|
|
Fair Trade in Ghana |
Blue Skies Products - Buy pineapples from smallholders - Direct export to EU - Blue Skies Organic Collective Association (BSOC) - 80 pineapple farmers - Harvest collection free of charge - Boreholes built in villages from raised income |
|
|
World rice cultivation EER stats |
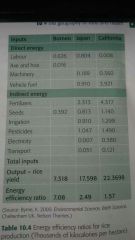
- 1.60 in California (Vehicle fuel and fertilizer highest energy input) - 2.50 in Japan (Fertilizer highest input, half of Canada) - 7.10 in Borneo (Labour highest energy input) |
|
|
World income loss for diseases of affluence |
- $3 billion in Brazil - $9 billion in India - $18 billion in China |
|
|
Causes of Malaria |
- Vector : Anopheles mosquito - 20 degrees Celsius to complete life cycle - Water bodies - No known vaccine for malaria - $5 Mosquito nets too expensive - Banning of DDT insecticide (carcinogenic & non-biodegradable) |
|
|
Impact of Malaria on sub-Saharan Africa |
- Kills 2.4 million sub-Saharan Africans annually - Reduce family incomes by 25% - $200 million in lost productivity (2005 - 2010) - Costs 40% of national health expenditure |
|
|
Solutions to Malaria |
- Cheap $5 mosquito nets - 50% reduction in infection rates - 20% reduction in child mortality |
|
|
Impact of HIV / AIDS in sub-Saharan Africa at a national level |
- 1.4 million deceased in 2008 - Direct medical cost US$30 per person annually - Public health spending only US$10 - Agricultural workforce in Namibia, Botswana and Zimbabwe will be 16% larger without HIV / AIDS - 40% Zambian midwives are HIV-positive (health worker) - |
|
|
Impact of HIV / AIDS in sub-Saharan Africa at a local level |
- On average 33% household income used for medical costs - 7 times monthly income for a funeral |
|
|
Antiretroviral treatment in sub-Saharan Africa |
- 90% Namibians have access - Only 10% of infected receive treatment - 200,000 infections prevented in children since 2001 - >10% death toll since 2005 - 2.9 million lives saved |
|
|
Obesity in Mexico |
- 2nd fattest nation in the world - 71% Women, 66% Men obese (2008) - 10% overall (1989) - 25% of children overweight |
|
|
Causes for obesity in Mexico |
- Common among population with US$2 mean daily income per capita - 75% schools serve soft drinks instead of water because fast food is cheaper - 205 McDonald restaurants (Ranked 16th) - Consumption increased 60% since 2005 - Only 32% children exercise daily |
|
|
Impacts of obesity in Mexico |
- 44% diabetes, 23% hear disease cases attributable to obesity - 10 million diabetic Mexicans - 70,000 annual deaths |
|
|
Diabetes in India |
- Highest prevalence rate in the world (9%) - Expected to increase 150% from 2000 to 2030 |
|
|
Causes of diabetes in India |
Patient compliance - 30% fail to take medications as prescribed - 37% fail to change diet Delay in diagnosis - 7 year time lag between education levels - 4 year time lag between income levels |
|
|
Impact of diabetes in India |
- Direct medical costs up to 25% household income |
|
|
Solutions of diabetes and their difficulties in India |
Government participation - diabetesindia.com - No national programme for diabetes - Only 1.2% government budget on diabetes Education / awareness - 6th largest country in the world - 18 major languages + 200 dialect Religious / Cultural differences - Meat is a sign of wealth and status |