Reading...
![]()
Play button
![]()
Play button
![]()
Use LEFT and RIGHT arrow keys to navigate between flashcards;
Use UP and DOWN arrow keys to flip the card;
H to show hint;
A reads text to speech;
22 Cards in this Set
- Front
- Back
|
Tail
-definition- |
The end of the distribution that has the fewest number of scores
|
|
|
Positively Skewed
-definition- |
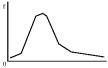
When the scores cluster at the left end (0, origin) of the distribution
|
|
|
Negative Skewed
-definition- |
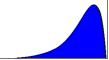
When the scores cluster at the right end of the distribution
|
|
|
Is there a way to get an idea of the amount of skewness? If so, how?
|
Yes.
Compare the median with the mean. |
|
|
Estimating amount of skewness
-explanation- |
Positive = mean LARGER than median
Negative = mean smaller than median |
|
|
Closer skewness is to zero...
|
The closer distribution is to being symmetical
|
|
|
Markedly Skewed
-definition- |
When a skewness value is greater than 1.0 or smaller than -1.0
|
|
|
Moderately (Slightly) Skewed
-definition- |
When a skewness is greater than zero, but less than 1
|
|
|
A distribution is Not normal if...
|
the ratio of skewness to standard error is greater than 2.0 or less than -2.0
|
|
|
Platykurtic
-definition- |
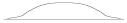
Large standard deviation with spread making graph spread out and flat
|
|
|
Leptokurtic
-definition- |

small standard deviations that leave graph with tall peaked curves
|
|
|
Mesokurtic
-definition- |
normal, bell-shaped distribution
|
|
|
Kurtosis of mesokurtic is...
|
near zero
|
|
|
Kurtosis of playkurtic is...
|
values smaller than -1.0
|
|
|
Kurtosis of leptokurtic is...
|
values greater than +1.0
|
|
|
z-curve/z-score
-alternate names- |
1)Standard normal distribution
2)Standard score |
|
|
z-score
-definition- |
Converting a raw score from a normal distribttion to a score in a standardized normal distibution
|
|
|
z-score allows us to do 4 things...
|
1)determine exact proportion of scores fall between any 2 scores
2)how a score relates to other scores 3)compare scores 4) estimate probability of an event |
|
|
z-score
-calculation- |
(Raw score - Mean)
------------------- Standard deviation |
|
|
If a score is Larger than the mean...
|
The z-score will be +
|
|
|
If a score is smaller than the mean...
|
the z-score will be negative
|
|
|
To determine the percentage of a score in relation to the whole, you should...
|
1)Calculate the z-score
2)Use a table to determine the percentage 3) Add 50.0 if you want the percentage under a score and Subtract from 50.0 to determine the percentage above the score |