Reading...
![]()
Play button
![]()
Play button
![]()
Use LEFT and RIGHT arrow keys to navigate between flashcards;
Use UP and DOWN arrow keys to flip the card;
H to show hint;
A reads text to speech;
14 Cards in this Set
- Front
- Back
|
What determines what will be the edge of the cortex in the developing brain?
|
The edge of the cortex is determined by the radial glia cells. The distal processes of all the radial glia cells form a layer at the surface called the glia limitans (which is inside the "marginal zone"). No cells can project beyond this layer.
|
|
|
What happens who the neuroblasts fail to reach the appropriate destinations during development? What causes these conditions? Name 2 manifestations of this condition?
|
The result is disorders of migration. These disorders are caused by genetic mutations. This condition can result in (1) too many cells, and/or (2) cells migrate to the wrong locations.
|
|
|
From a macroscopic perspective, what are 2 manifestations of disorders of migration?
|
In mice (which are lissencephalic [no gyri]), mutation can make them have gyri.
In humans, mutation can make us lissencephalic (less cells) or pachygyria (more cells, larger gyri). |
|
|
Where can disorders of migration occur in mice?
|
The midline and the dorsal surface.
|
|
|
What are ectopias? What is the consequence?
|
Ectopias are cells that have implanted themselves in areas where they shouldn't be. (Like how in ectopic pregnancy the zygote gets implanted in the fallopian tube.) They don't get the "STOP" signal, and overshoot the glia limitans. The consequences of ectopias can be either enhancement or deficit depending on location.
|
|
|
What are the 2 questions associated with sample size? What is the relationship between sample size and precision?
|
1. Is the sample representative?
2. Is the sample size sufficient to determine whether your result is significant or not? (Statistics gives you a way to know what sample size you'd need to determine this.) As sample size increases, the precision of your results increases. |
|
|
When does the mean not equal the median? How can this happen? What do these 2 distributions look like?
|
Unless you have a normal/Gaussian/symmetric distribution, the mean will not equal the median. This can happen when you have a few extreme (high or low) score. These distributions look skewed.
|
|
|
What are SEM and SD? How are they similar? How are they different?
|
SEM and SD are both measures of variance. SD is the variance in scores with respect to the mean, whereas SEM shows what the spread of variance would look like if you kept taking samples. SEM is smaller than SD.
|
|
|
What is meant by parametric statistics?
|
Parametric statistics refer to the procedures used for normal/Gaussian/symmetric distributions. T-tests and ANOVAs are for parametric distributions only.
|
|
|
What is the central question in statistics? What is this issue reduce to? Give an equation?
|
Are two groups different? The real issue here is signal/noise = (difference btw group means)/(internal variability within each group) = t-value. As intra-group variability increases, t-value decreases.
|
|
|
What are "relationships" in statistics? How do we model relationships, and then compare them?
|
Relationships are interactions between multiple variables. You make a scatterplot and superimpose a best-fit line. Regression analysis lets us compute the significance of such relationships.
|
|
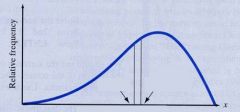
What distribution is this? Where are the extreme values? Identify the mean and median.
|
This is a leftward-skewed distribution. The extreme values are on the left (on the tail). The mean is close to the tail, and the median is closer to the center.
|
|
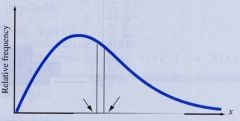
What distribution is this? Where are the extreme values? Identify the mean and median.
|
This is a rightward-skewed distribution. The extreme values are on the right (on the tail). The mean is close to the tail, and the median is closer to the center.
|
|
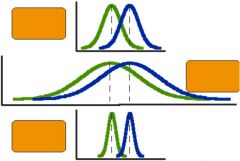
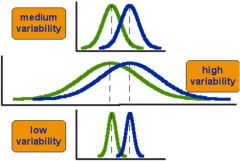
Rank these in terms of variability.
|
|