Reading...
![]()
Play button
![]()
Play button
![]()
Use LEFT and RIGHT arrow keys to navigate between flashcards;
Use UP and DOWN arrow keys to flip the card;
H to show hint;
A reads text to speech;
10 Cards in this Set
- Front
- Back
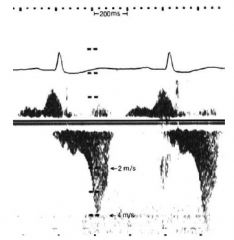
The following signal was obtained from the apical view in a 45-year-old man with a |
Answer: C.
Left ventricular cavity obliteration. The thin dagger suggests a diminishing flow area in late systole. Though this can occur on left ventriclular outflow obstruction due to SAM, the peak tends to be a little earlier at this gradient. A very late peaking signal is suggestive of cavity obliteration. This is a complete velocity profile and flow acceleration is clearly seen. In mitral valve prolapse, an incomplete signal may give a spurious late peaking signal. Signal profile depends solely on the left ventricular to left atrial pressure gradient in MR; only the signal intensity depends on the instantaneous regurgitant flow rate, which determines the number of scatterers. |
|
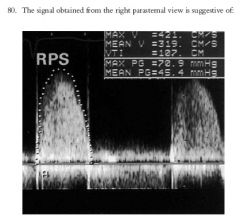
The signal obtained from the right parasternal view is suggestive of:
A. Severe MR B. Severe aortic stenosis C. Severe aortic regurgitation D. Severe pulmonary stenosis |
Answer: B.
Severe aortic stenosis. This is a signal occupying the ejection phase and directed to the right shoulder, which is typical of aortic stenosis. A flail posterior mitral leaflet may cause a jet directed in this direction but is holosystolic starting with the QRS complex. The signal of aortic regurgitation is diastolic. The pulmonary stenosis signal is recorded best from the left parasternal, apical or subcostal locations. |
|
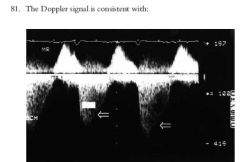
81. The Doppler signal is consistent with:
A. Severe aortic regurgitation and moderate aortic stenosis B. Severe mitral stenosis C. Acute severe mitral regurgitation D. Ventricular septal defect |
Answer: C.
Acute severe mitral regurgitation (MR). The image shows the classical ‘‘V wave cut-off ’’ sign. The rapid deceleration of the MR velocity profile following the peak velocity is due to a rapidly diminishing left ventricular to left atrial (LV–LA) pressure gradient secondary to a large V wave in the left atrium that is a feature of severe MR, especially when it occurs acutely. |
|
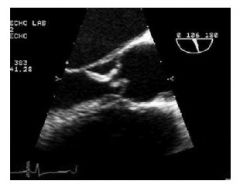
226. The image is suggestive of:
A. Aortic dissection B. Aortic valve endocarditis C. Unicuspid aortic valve D. Hypertrophic cardiomyopathy |
226. Answer: B.
Large vegetations are seen on the aortic valve. Ascending aorta is normal sized with no visible flap. Unicuspid aortic valve can be diagnosed only in the short axis view showing only a single cusp and a single commissure. |
|
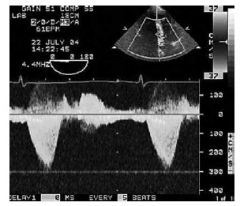
Continuous wave Doppler shown here could be a result of:
A. Hypertrophic obstructive cardiomyopathy B. Severe mitral regurgitation C. Tricuspid regurgitation D. Ventricular septal defect |
Answer: A.
Late peaking systolic signal is indicative of dynamic LV outflow tract obstruction, which is most severe in end systole when the LV volume is minimal. The timing corresponds to LV ejection and begins following a period after the onset of the QRS signal. There is a gap between the end of the signal and onset of mitral inflow. The MR signal occupies not only the ejection period but also the isovolumic contraction and relaxation periods, is a longer signal and is continuous with the mitral inflow without any intervening gap. The tricuspid regurgitation (TR) signal is similar but tends to be broader with a lower velocity inflow. The cursor position, if visible, is also helpful to identify the origin of the signal. The ventricular septal defect signal is holosystolic but generally tends to have a presystolic component due to left atrial contraction. |
|

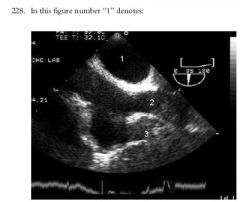
In this figure number ‘‘1’’ denotes:
A. Left atrium B. Right atrium C. Aorta D. Right pulmonary artery number |
Answer: A.
This TEE long axis view of the left atrium and right atrium is also popularly called a bicaval view; the left atrium is immediately anterior to the esophagus. |
|
In the figure number ‘‘2’’ is:
A. Superior vena cava B. Inferior vena cava C. Pulmonary artery D. Aorta Chapter 12 | 71 |
Answer: A.
In a vertical or near vertical plane, the right side is cephalad and the left side is caudal. |
|
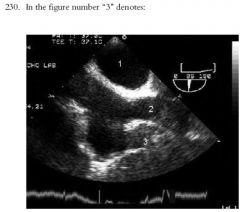
In the figure number ‘‘3’’ denotes:
A. Left atrium B. Right atrial appendage C. Inferior vena cava D. None of the above |
Answer: B.
Right atrial appendage���� |
|
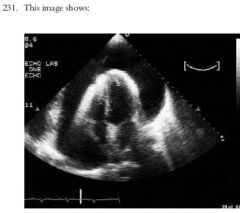
This image shows:
A. Large left pleural effusion B. Large pericardial effusion with no evidence of tamponade C. Large pericardial effusion with features of tamponade D. Mirror image artifact |
231. Answer: C.
This figure shows pericardial effusion with features of tamponade (right atrial collapse). |
|
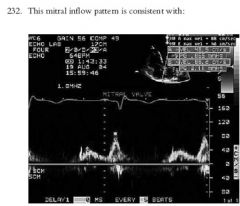
This mitral inflow pattern is consistent with:
A. Abnormal left ventricular (LV) relaxation with elevated left atrial (LA) pressure B. Abnormal LV relaxation with normal LA pressure C. Pseudonormal filling D. Restrictive LV filling |
Answer: B.
Abnormal LV relaxation pattern includes prolonged LV isovolumic relaxation time (>100 ms), E/A ratio <1 and E-wave deceleration time >250 ms. |