• Shuffle
    Toggle On
    Toggle Off
  • Alphabetize
    Toggle On
    Toggle Off
  • Front First
    Toggle On
    Toggle Off
  • Both Sides
    Toggle On
    Toggle Off
  • Read
    Toggle On
    Toggle Off
Reading...
Front

Card Range To Study

through

image

Play button

image

Play button

image

Progress

1/15

Click to flip

Use LEFT and RIGHT arrow keys to navigate between flashcards;

Use UP and DOWN arrow keys to flip the card;

H to show hint;

A reads text to speech;

15 Cards in this Set

  • Front
  • Back

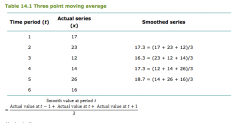
What is the forecast period for the moving average?

It is simply two periods (i.e. weeks) ahead of the exponential moving average

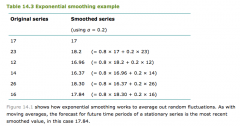
What is the forecast period for the exponential moving average?
It is simply the one period (i.e. weeks) ahead of the exponential moving average

How to you calculate the accuracy of moving average using the mean square.

Mean Square (moving average)


Sum Difference^2

________


Number of points compared


Difference = Actual – Forecast

How to you compare the accuracy of moving average vs exponential moving average using the mean square?
The lower the MSE, the closer is the forecast to the observed data

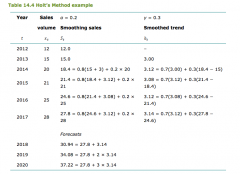
If there is a trend what method should you use?

Holts method takes into consideration the trend

If there is a trend and seasons what method should you use?

Holt Winters Method

Write a report on your findings and on the assumptions you have made.Discuss the relevance ofmethods used and recommend possible improvements.
  • (Data period) Data are only available for a short period of time. The period should be extendedand further monitoring should take place.
  • (Assumption with moving/exponential average) It has been assumed that this is a stationary series with a constant variance, butthere is a clear upward trend. This makes Holt’s Method a more appropriatemethod for forecasting, as it takes into account the trend in the data.
  • (Constants) smoothing constant may not have been optimal for the data. Alternativeconstants should be tried and the smoothed values tested with the mean squareerror or the mean absolute deviation.
Describe the three major categories of forecasting techniques. Give at least two relevant examples for each ofthe categories.


Three categories of major forecasting techniques are:


  • Qualitative methods are based on using judgement rather than historical data andshould be made in a systematic way. They may be the only methods availablewhen dealing with new products or new technology, or when dealing with politicalor economic uncertainties. Examples include the launch of new products orservices.
  • In causal modelling, the variable to be forecast is related statistically to one ormore other variables. The model is chosen to fit existing data and the assumptionis made that the relationship will still hold in the future. Bi-variate and multi-variate regression are both examples of causal modelling. Practical examples wherecausal models are used include economic series, oil prices, and insurancepremiums.
  • Time series methods allow patterns in existing historical data to be analysed. Inparticular, cycles, trends and seasonal factors can be analysed numerically and usedto project these patterns into the future. Two assumptions are usually made: thatconditions are stable and that short-term forecasts are required. Examples includehouse prices and share movements.

How do you calculate a 3 point moving average?


How to do you calculate an exponential moving average?

How do you calculate Holtz Method?

Write a report on your findings. Indicate any other information you would consider relevant. Detail your recommendations for further research and analysis?
  • The average number of customers was 155 if all restaurants and weeks areconsidered. However, looking at the five weeks, week 4 was the busiest with anaverage of 196 customers, while week 3 was the lowest with an average of 110customers. There was found to be a significant difference in the average numberof customers for the weeks, at the 1% level of significance.
  • Similarly, there was a significant difference in the average number of customers forthe four different restaurants, at the 1% level of significance. The number inRestaurant 3 was consistently lower, with a mean of 85 customers. Restaurant 2was the busiest with an average of 242 customers.
  • Information would be required on the types of restaurant and their size, customertype, pricing and location. Further information would be needed on the particularweeks: were any of them holiday weeks or weeks including a bank holiday? A weekwhich included a monthly pay-day might also affect business.
  • No information is given on how the restaurants or weeks were selected, andwhether they were representative of the population.

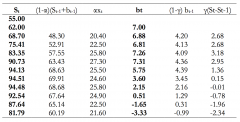
How do you set out the calculations for Holtz method?

How do set out the calculation to forecast for Holtz method?

Holtz Method


Write a short report describing any assumptions you have made andcommenting on the reliability of the forecasts? Discuss the relevance of any alternative models that could have been used.

  • Reliability The data show an upward trend for the first six quarters, but then decrease. The series is too short to determine whether seasonal or cyclical effects are present. The mobile phone market is fast-moving, and the service contracts offered change frequently. There is no information on the number of customers who decide to stop their contracts in this period.
  • Assumptions Holt’s method is suitable for analysis of a series with a trend but with noseasonal or cyclical patterns. The calculationsaboveassume that thevalues of alpha and gammaareappropriate. The method also assumes that external factors remain constant,since noaccount is taken of them.
  • Alternative methods If seasonal factors are present, then Holt–Winter’s should be used. If seasonal factors and cyclical effects are present, then a decomposition method should be considered. Mean Square Error can be used to compare models. Residuals should also be examined to detect any outliers and patterns.