![]()
![]()
![]()
Use LEFT and RIGHT arrow keys to navigate between flashcards;
Use UP and DOWN arrow keys to flip the card;
H to show hint;
A reads text to speech;
10 Cards in this Set
- Front
- Back
|
Core Periphery Model |
According to the world systems theory, the world is divided into three types of countries or areas: core, periphery, and semi-periphery. Core countries are dominant capitalist countries that exploit peripheral countries for labor and raw materials.
|
|
|
Peters Projection
|
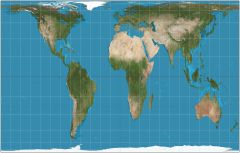
Map projection that maintains area, but distorts shape. |
|
|
Mercator Projection
|
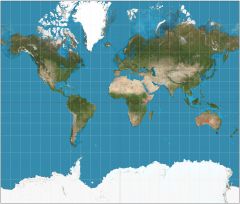
Map projection by which direction is accurate, but area is distorted on rectangular grid. |
|
|
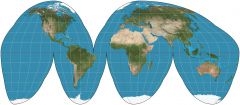
Fuller Projection |
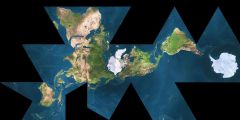
Map projection that maintains shape and area but loses direction.
|
|
|
Goodes-Homosline Projection |
Map projection that maintains area but divides oceans which distorts distance.
|
|
|
Robinson Projection
|
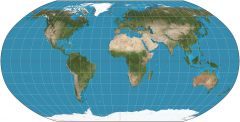
Map projection that equally distorts all four aspects. |
|
|
Scale
|
Maps are drawn to scale, which means there is a direct connection between a unit of measurement on the map and the actual distance on Earth. |
|
|
Isoline Map |
a map with continuous lines joining points of the same value (weather, wind speed etc). |
|
|
Cartogram
|
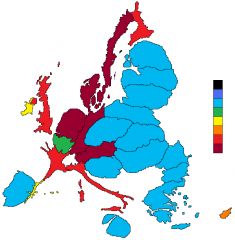
a map in which some thematic mapping variable – such as travel time, population, or Gross National Product – is substituted for land area or distance.
|
|
|
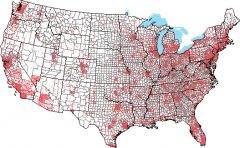
Dot Density Map
|
A quantitative, thematic map on which dots of the same size are randomly placed in proportion to a numeric attribute associated with an area. Dot density maps convey the intensity of an attribute. |