![]()
![]()
![]()
Use LEFT and RIGHT arrow keys to navigate between flashcards;
Use UP and DOWN arrow keys to flip the card;
H to show hint;
A reads text to speech;
87 Cards in this Set
- Front
- Back
|
Discriminant Validity |
discriminant validity tests whether concepts or measurements that are supposed to be unrelated are, in fact, unrelated |
|
|
Convergent Validity |
Convergent validity refers to the degree to which two measures of constructs that theoretically should be related, are in fact related. |
|
|
Construct Validity |
Construct validity is “the degree to which a test measures what it claims, or purports, to be measuring.” |
|
|
Criterion Validity |
Criterion validity is a measure of how well one variable or set of variables predicts an outcome based on information from other variables |
|
|
Content Validity |
Content validity refers to the extent to which a measure represents all facets of a given social construct. |
|
|
Face Validity |
Face validity is the extent to which a test is subjectively viewed as covering the concept it purports to measure. It refers to the transparency or relevance of a test as it appears to test participants. |
|
|
Reliability |
reliability is the overall consistency of a measure |
|
|
Test-Retest |
Test-retest reliability is a measure of the consistency of a psychological test or assessment. |
|
|
Internal Consistency (Cronbach's Alpha) |
internal consistency is typically a measure based on the correlations between different items on the same test (or the same subscale on a larger test). |
|
|
Interrater Reliability |
If various raters do not agree, either the scale is defective or the raters need to be re-trained. |
|
|
Simple Random Sampling (Probability Sampling) |
Equal, independent chance of being chosen. |
|
|
Systematic Sampling (Probability Sampling) |
In systematic random sampling, the researcher first randomly picks the first item or subject from the population. Then, the researcher will select each n'th subject from the list. You must start at a random point. |
|
|
Stratified Random Sampling (Probability Sampling) |
In stratified random sampling, the strata are formed based on members' shared attributes or characteristics. A random sample from each stratum is taken in a number proportional to the stratum's size when compared to the population. These subsets of the strata are then pooled to form a random sample. |
|
|
Multistage Cluster Sampling (Probability Sampling) |
larger clusters are further subdivided into smaller, more targeted groupings for the purposes of surveying. |
|
|
Convenience Sampling (Non-Probability Sampling) |
subjects are selected because of their convenient accessibility and proximity to the researcher. |
|
|
Purposive Sampling (Non-Probability Sampling) |
selected based on the knowledge of a population and the purpose of the study. The subjects are selected because of some characteristic. EXAMPLE: Because they are experts in the field. |
|
|
Quota Sampling (Non-Probability Sampling) |
assembled sample has the same proportions of individuals as the entire population. EXAMPLE: We want 50/50 men and women. |
|
|
Snowball Sampling (Non-Probability Sampling) |
appropriate to use in research when the members of a population are difficult to locate. The sample gets bigger and bigger but through referral or word of mouth. |
|
|
Cross-sectional (Survey Design) |
The defining feature of a cross-sectional study is that it can compare different population groups at a single point in time. EXAMPLE: Study done in 2005, compare age group 25-30 to 31-36. |
|
|
Longitudinal (Survey Design) |
The benefit of a longitudinal study is that researchers are able to detect developments or changes in the characteristics of the target population at both the group and the individual level. The key here is that longitudinal studies extend beyond a single moment in time. |
|
|
Trend Study (Longitudinal) |
A trend study samples different groups of people at different points in time from the same population. EXAMPLE: Study patterns of music in those in their 20-30's in 2005 and 2015. |
|
|
Cohort Study (Longitudinal) |
People who share the same event (birth cohort, marriage cohort, etc.) and are followed longitudinally. Doesn't have to be the same sample, but must be in the same cohort. EXAMPLE: Study of those born in 1980 in 1995, 2005, and 2015, but not necessarily with the same people. |
|
|
Panel Study (Longitudinal) |
The key feature of panel studies is that they collect repeated measures from the same sample at different points in time. EXAMPLE: Study same group of people in 1995, 2005, and 2015. |
|
|
Shedler & Block (1990) |
Drug Use Study - Longitudinal study that said drug use is an undesirable but normal event. Tried to link personality and drug use, but there were confounding variables like type of parenting style. |
|
|
Threats to Construct Validity (List 'Em) |
1) Poorly operationalized measures 2) Poor manipulation 3) Researchers' expectancies 4) Participants' bias --Participant expectancies --Participants reactance --Evaluation apprehension |
|
|
Poor operationalized measures |
You end up measuring something else because construct was not clearly defined (no face, content, or criterion validity) |
|
|
Poor manipulation |
If participants didn't perceive it in the way you expected or wanted, and therefore you get skewed results. |
|
|
Researcher's expectancies |
Researchers influence outcome due to ques given to participants. EXAMPLE: Han the Horse -- people thought the horse knew math but he was conditioned to know the ques of his owner for correct answers. |
|
|
Participants' bias |
Participants know they're being study and effect the results. |
|
|
Participant expectancies |
Participants want to be helpful by trying to confirm the hypothesis. (Because they "know" the hypothesis.) |
|
|
Participant Reactance |
Participants try to disconfirm the hypothesis because they do not like being studied and attempt to reassert their independence. (Because they "know" the hypothesis) |
|
|
Evaluation Apprehension |
Give any answer to not feel uninformed. Social desirable answers given. Participants do not know the hypothesis but want to look good in front of the researcher. |
|
|
Threats to External Validity (List 'Em) |
Can't generalize. 1) Selection bias 2) Non-Response 3) Mortality (Homogeneous attrition) |
|
|
Selection Bias |
an error in choosing the individuals or groups to take part in a scientific study. EXAMPLE: Over-representation of females to males, therefore skewing results. |
|
|
Non-Response |
Small percentage of participants actually response. Response rate is important because it can indicate a flaw in the system. |
|
|
Mortality (Homogeneous attrition) |
When participants drop out of the study. Those who stay can indicate a flaw in the study. |
|
|
Threats to Internal Validity (List 'Em) |
Internal validity is important to understand causality (through experiments). 1) Individual differences 2) Maturation 3) History 4) Mortality (heterogeneous attrition) 5) Instrumentation 6) Regression to the mean |
|
|
Individual differences |
individuals differ in their behavior and the processes that underlie it. |
|
|
Maturation effects |
This has to do with time and the effect that time has on people.
Maturation refers to a natural process that leads participants to change on the dependent
After all, experiments do not happen overnight, but often over a period of time, whether days, weeks, a few months, or in some cases, years. |
|
|
History |
History refers to any external or historical event that occurred during the course
For instance, in the 70s soon after Head Start began, Sesame Street also began airing. Because Sesame Street includes lots of educational information, perhaps it could have been responsible for the apparent effects of Head Start. |
|
|
Instrumentation |
An improvement or decline that because of
EXAMPLE: Changes in the measurement techniques. You give a survey to people, but you saw a mistake, you fix it, but you still consider the surveys from before viable and therefore add it to the average. Your results are skewed. |
|
|
Regression to the mean |
It has to do with a sort of statistical fluke. Whenever scores fluctuate over time for any reason, extreme scores tend to move toward the middle, and middle scores tend to move toward the extreme.
EXAMPLE: You score really high or really low, but second time you score averagely. |
|
|
What is the art of asking questions? |
1) Ensure comprehension - frame the questions so all participants understand (8th grade reading level) 2) Convey relevance - keep attention by showing that participation is connected to them and they will work harder 3) Maintain interest - if the survey is long, try to keep their attention by creating more interaction and using transitions |
|
|
What are "techniques for enhancing cooperation"? |
1) Establish legitimacy - tell them you're not a marketer; name drop UCLA 2) Identify incentives - not just about the money, but also about letting them express their opinions. 3) Use social influence techniques - appeal to altruism, BIRG (basking in reflected glory) by appealing to importance of the research, and/or personalize the survey. |
|
|
What are the "5 Elements of Consent"? |
1) Layout the reason for the study - no need to hide information. 2) Reveal the institution - name drop UCLA or professors will help 3) Be upfront about the involvement, especially about follow up that needs to be done. 4) Provide contact information for participants 5) Tell them if it is anonymous or not, if not then how will confidentiality be kept. 6) Financial incentives (iPad or big gifts will be "coersion" instead. |
|
|
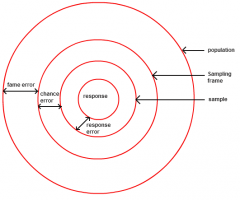
Sampling (Image demonstration) |
|
|
|
What makes couples more likely to stay together and be happy? Gottman & Krokoff 1989 |
Study found that those who were defensive, stubborn, and withdraw from interaction predicted relationship deterioration.
Observational data. (Video taped, coded behaviors)
By arguing, it helps relationships in the long run. |
|
|
What makes Americans happy? Oishi, Kesebir, and Diener, 2011 |
Equality is better than increased income. Explained by declining trust and perceived fairness. Archival data. |
|
|
Can newscasters affect who you vote for? Mullen, et al. 1986 |
Those who watched Peter Jennings were more likely to vote for Reagan than for Mondale in 1984. Must note that those who watched certain channels were already biased. Archival data, telephone survey. |
|
|
A variable chosen to measure a theoretical construct usually... |
Measures other constructs as well. |
|
|
Dr. Garces is leading a research team to assess how high school students feel about violence in schools. He got a list of all the high schools within the US and randomly selected high schools. Then he randomly selected students from each of these selected schools. What kind of sampling procedure was used in this study? |
Multi-stage cluster sampling |
|
|
An example of social desirability response bias is... |
a systematic error in measurement |
|
|
Scientists attempt to avoid biases when examining hypotheses by ... |
submitting research to critical review by other scientists. |
|
|
If the relationship between two variables is caused by a third variable, we say that their relationship is... |
spurious (false/fake) |
|
|
Gaby and Paul have developed a new measure of thrill seeking. The best way for them to establish the discriminant validity of this scale, they should... |
see how it relates to measures of sociability. |
|
|
Operational definitions can... |
be replicated by different researchers (because they are clear and concise enough to be replicated) |
|
|
Random Error |
Random errors in experimental measurements are caused by unknown and unpredictable changes in the experiment. These changes may occur in the measuring instruments or in the environmental conditions.
EXAMPLE: electronic noise in the circuit of an electrical instrument. |
|
|
Systematic Error |
Systematic errors in experimental observations usually come from the measuring instruments. EXAMPLE: the instrument is wrongly used by the experimenter. |
|
|
Why is a continuous measure better than a categorical measure? |
Continuous measure allows for more flexibility in analysis. You can always recode the data to turn a continuous measure into a categorical measure.
EXAMPLE: What year were you born? ____ Later to be coded by years or chunks. |
|
|
Nominal scale |
The nominal type differentiates between items or subjects based only on their names or (meta-)categories and other qualitative classifications they belong to. EXAMPLE: gender, nationality, ethnicity, language, genre, style, biological species, and form. |
|
|
Ordinal scale |
The ordinal type allows for rank order (1st, 2nd, 3rd, etc.) by which data can be sorted. |
|
|
When should you use "statements" when formatting questionnaires? |
Use statements when the information requires more cognitive processing for respondents to report about attitudes.
When trying to measure attitudes, a statement format is a good way to go. |
|
|
When should you use "questions" when formatting questionnaires? |
Items assessing objective information are easier to respond to and lend themselves to the question format. |
|
|
Why should you use an open-ended questions? |
No clear response options provided. Allows a more unique perspective; generate new insights. Hard to code. |
|
|
Why should you use a closed-ended question? |
A clear set of response options provided. Easy to code, get what you are looking for. BUT you can miss an option you weren't even considering. |
|
|
Closed ended questions should be... |
Exhaustive and mutually exclusive.
All possible responses are included. Do not overlap. |
|
|
How do you make items clear? |
Keep it short and simple.
Be clear and unambiguous. |
|
|
What is a double-barrel question? |
Asking 2 or more questions in a single question. |
|
|
What are leading questions? |
Questions that encourage respondents to answer in a particular way are leading and biased.
EXAMPLE: Appeals to authority - "Don't you agree with the President..." |
|
|
Ask questions that respondents are ... |
competent to answer.
Ask questions they know about. |
|
|
What are lead-in questions? |
Instructions that are clear and precise. Easy, non-threating, and interesting introduction to the questionnaire. |
|
|
What is an example of a bad lead-in? |
Demographics - too boring. What is your annual income - too sensitive. how many hours did you study last week? - too hard to answer.
|
|
|
Where should sensitive items be placed? |
AT THE END. |
|
|
Similar items on a questionnaire should... |
be clustered together. |
|
|
What are the research goals? (List 'em) |
1) Description 2) Prediction 3) Understanding |
|
|
What are the ways of knowing? (List 'em) |
1) Authority 2) Logic 3) Intuition 4) Observations |
|
|
What are errors in observations? |
1) Inaccurate observations 2) Overgeneralization 3) Confirmation bias |
|
|
Internal validity
|
Allows researcher to draw conclusions about causal relationships. (Usually through experiments.)
|
|
|
Confounds |
Uncontrolled variables that leave open alternative explanations.
In correlational data, we use 'third variable'. |
|
|
Control |
Manipulate the independent variable holding all other factors constant. |
|
|
Random assignment |
Randomly assigning participants in conditions; helps internal validity. |
|
|
Matching |
pre-test before placing into random assignment. |
|
|
When are experiments not appropriate? |
1. Demand characteristics (causes participant expectancies). 2. Ethical dilemmas 3. Impossible to manipulate variables 4. Problems generalizing |
|
|
Naturalistic observation |
observe in natural environment, do little to be seen |
|
|
Participant-observer research |
when researcher joins the environment |
|
|
Archival Research |
look at past events and behaviors through reports. can be limiting and cannot guarantee quality. |
|
|
A well-written hypothesis must... |
1. make a prediction about the relationship between two [or more] variables 2. the predicted relationship must be unambiguous |