![]()
![]()
![]()
Use LEFT and RIGHT arrow keys to navigate between flashcards;
Use UP and DOWN arrow keys to flip the card;
H to show hint;
A reads text to speech;
37 Cards in this Set
- Front
- Back
- 3rd side (hint)
|
Types of economies |
- free market economy (efficiency) - mixed economy - command economy (equity) |
|
|
|
Explain PPC |
Production possibility curve - inside the curve is inefficient - outside is unattainable with the resources - value/ opportunity cost will change at the edges > that’s why it’s curved Eg: 1 remaining chocolate bar is much more valuable than 100 |
|
|
|
Explain price and non price determinant shifts in curve (eg demand curve) |
- if price changes, there is a change ALONG the demand curve - if there is non price determinant, the demand curve shifts left or right |
|
|
|
Determinants of PED |
S - number/closeness of substitutes P - proportion of income L- luxury or necessity A - addictive ness T - amount of time the consumer has time to respond |
|
|
|
What happens to producer revenue depending on PED |
Elastic : increase in price causes a fall in revenue, decrease in price causes a rise in revenue Inelastic: increase in price causes a rise in revenue, decrease in price causes a fall in revenue |
|
|
|
Explain the Engel’s curve |
Demand for inferior goods is not so clear cut: When income increases, instead of demand going down for inferior goods, people might still buy more of it for a while depending on your income Engels curve illustrates Qd of good and income over time The poorer the family is, the more it spends on food until income reaches a high enough level to switch to normal/superior good |
|
|
|
Determinants of PES |
Time following change in price: - the market period (is you have remaining stock), the short run (labor), the long run (other FOP’s) Mobility of FOP: - elastic supply (manufactured goods, low skilled services) - inelastic supply (primary commodities, heavy manufactured goods, high skilled services) Ability to store stocks: - depends on size, perishability Amount of unused capacity |
|
|
|
Effects of taxes on stakeholders |
Consumers: Worse off, demand decreases, satisfaction decreases Producers: Less need for supply, revenue decreases, workers decreases Government: Better off, gain in revenue Society: Taxes on certain items changes the social norm. The government uses tax for social enrichment. Inappropriate goods are taxed |
|
|

Label this graph of taxes |

Back (Definition) |
|
|
|
What are the different effects of taxes on different goods |

Elastic goods: Tax burden is larger for producers (PED>PES) Inelastic goods: Tax burden is larger for consumers (PES>PED) |
|
|
|
Example of a subsidy |
Cows in Japan: - ¥250,000 for each cow - lots of subsidies for cows because cows are linked to dairy, leather industries +takes a lot of money to take care of cows |
|
|
|
What is the relation between local governments and subsidies |
Local governments sometimes grant huge subsidies to companies in order for them to create a base there. > those creates jobs >bring skilled people in the area |
|
|
|
Purpose of a subsidy (1) + examples and reasons |
Aim to increase consumption of products by lowering the price |
- primary commodities: to make it affordable - domestic products: to protect their own industries - education: to increase the PPC curve, long term growth |
|
|
Purpose of a subsidy (2) + examples and reasons |
Government want to support an industry by helping with their production costs - IT: for growth AI: growth |
|
|
|
Example of an unintended consequence of a subsidy |
Irrigation subsidies has had unintended consequences as it encourages intensive farming and leads to overuse and ineffective use of water |
|
|
|
Explain a subsidy graph |
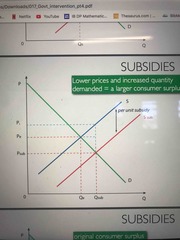
A subsidy will cause the supply curve to shift right by the amount of the subsidy. |
|
|
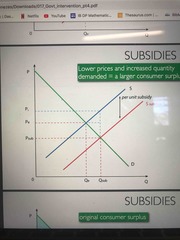
Label a subsidy graph |
|
|
|
|
Disadvantage of subsidies |
- unintended consequences - the transfer efficiency of a subsidy is usually low > they often benefit richer people instead of the targeted disadvantaged group - there’s an opportunity cost (government expenditure) |
|
|
|
Why would a government impose taxes? |
- a source of government revenue (PED) - to discourage consumption of goods that are harmful - to distribute income evenly |
|
|
|
Effect of a subsidy on stakeholders |
Consumers: Make them better off>cheaper+increase in quantity purchased Producers: Better off. Revenue increases Government: Burden to their budget. Have to reduce expenditure somewhere else Workers: Better off. Hired more. Foreign producers: Worse off and harder to compete due to the lower prices |
|
|
|
Why would a price ceiling be imposed? |
To prevent too many consumers from being excluded/make goods affordable when the market price is too high |
|
|
|
Why would a price ceiling be imposed? |
To prevent too many consumers from being excluded/make goods affordable when the market price is too high |
|
|
|
Example of a price ceiling |
Usually on staple foods, medicine, gas, rent Eg: Venezuelan government put a price ceiling on foods as it was thought that producers may exploit and sell their goods at an unfair price to consumers |
|
|
|
Explain the graph for price ceilings |
Back (Definition) |
|
|
|
Explain the Consequences of a price ceiling |
- shortages Demand increases due to lower price and supply decrease as producers received less revenue (some suppliers may even switch to another good) - non price rationing In a free market, rationing is achieved by the price system. Those that afford it get it. But since a shortage exists systems such as first come first serve, favoritism, raffling is used - black market It exists due to dissatisfied people who could not buy the good - inefficient allocation of resources Since supply is not at its optimal level> underproduction. A price ceiling also creates deadweight indicating allocative inefficiency. |
|
|
|
Why would a price floor be imposed by the government |
- to provide income support for farmers by offering them prices for their products above the market price => especially important because it can help limit the impact of farmers income from volatility in prices (social unrest doesn’t happen) - to protect low skilled workers by offering then a wage above the market level |
|
|
|
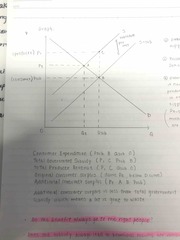
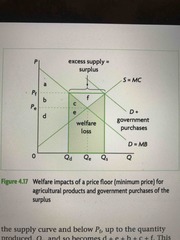
What are the consequences of a price floor |
- surpluses - government measures to dispose surpluses => store it. Costs and perishable => export it. Requires a subsidy to decrease costs and compete in the global market. Costs the government and they are also many regulations to exporting - Firm inefficiency =>there is no incentive to cut costs - negative welfare impacts Producer surplus changes from d+e to d+e+b+c+f. Since there is a surplus, the government attempts to buy it as represented: Pf x Qs - Qd Therefore negative welfare is the shaded area in hint picture |
|
|
|
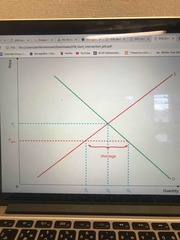
Explain price floor graph |
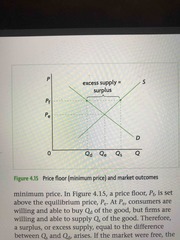
Price is set above the equilibrium price. Causes a surplus. |
|
|
|
Explain a graph showing government buying excess surplus after a price floor |

Back (Definition) |
|
|
|
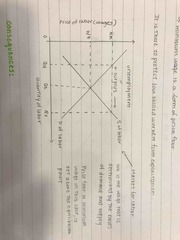
Explain a minimum wage graph |
Back (Definition) |
|
|
|
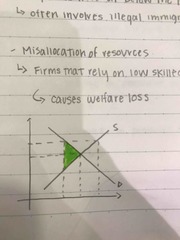
What are the consequences of a minimum wage |
- labor surplus / unemployment Likely to involve unskilled workers - Illegal workers below the minimum wage Likely to involve illegal immigrants - misallocation is resources Firms that rely on low skilled labor are forced to cut workers and supply. This causes welfare loss (see pic on hint)
|
|
|
|
What are the three types of market failure? |
- market power - asymmetrical information - externalities |
|
|
|
Explain optimal efficiency |
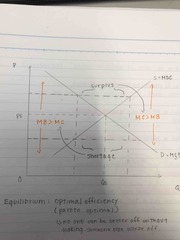
When no one else is affected by by your consumption or production of a good or service MSB=MSC |
|
|
|
Explain the graph for a negative externality of production |

The graph also explains how the free market over allocates resources to the production of a good and too much of it is produced relative to the social optimum => causes welfare loss (triangle between supply curves) |
|
|
|
What are the ways to correct a negative externality (1) |

Government regulations This includes: - putting regulations (law against banning waste) - ban materials (toxic chemicals) - develop new technology to reduce emissions Pros of government regulation: - it internalizes the externality by forcing producers and consumers to pay for the externality (more practical) - they have to follow the law Cons of government regulation: - incurs higher costs for firms causing consumers to switch to alternatives. They may go out of business (especially if their good is elastic). Unemployment increases as a result. - enforcing can be difficult and expensive and avoided. |
|
|
|
How can you correct a negative externality (2) |
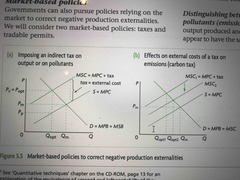
Taxes: Tax on the firm per unit of output Or Tax on the firm per negative externality (like every unit of emissions) 2 possible changes: - MPC moves all the way to MSC - MPC moves closer to MSC *remember the effects on different stakeholders: Consumers have to pay a higher price, producers lose revenue, government gains revenue (show that one graph) Pros: - Tax can be imposed as much as possible until the externality is gone - encourages firms to invent ways to reduce emissions (hybrid cars) Cons: - difficult to determine what gets taxed, how much should be taxed and some thing are not measurable |
|
|
|
Explain negative externality of consumption |
Example: Smoker enjoys a cigarette (MPB) but we have to pay for his health care from tax (MSB) therefore MPB is higher than MSB. => this means goods are being overproduced, creating a misallocation if resources |
|