![]()
![]()
![]()
Use LEFT and RIGHT arrow keys to navigate between flashcards;
Use UP and DOWN arrow keys to flip the card;
H to show hint;
A reads text to speech;
61 Cards in this Set
- Front
- Back
|
First completed genome sequence and year completed |
H. influenzae
1995 |
|
|
Genome size comparison |
Human - 46 chromosomes - 28-35,000 genes - 3.1 billion bp
Mouse - 40 chromosomes - 22.5-30,000 genes - 2.7 billion bp
Puffer fish - 44 chromosomes - 31,000 genes - 365 million bp
Malaria mosquito - 6 chromosomes - 14,000 genes - 289 million bp
Fruit fly - 8 chromosomes - 14,000 genes - 137 million bp
Roundworm - 12 chromosomes - 19,000 genes - 97 million bp
Bacterium - 1 chromoneme - 5,000 genes - 4.1 million bp
|
|
|
Biggest genome
Mid size genome
Smallest genome |
Free living organisms
Obligate parasites
Obligate symbionts |
|
|
Smallest genomes: obligate symbionts |
Hodgkinia cicadicola
* 142 kb genome * lives in specialized insect cells (bacteriocytes) * cannot repair DNA * no lipopolysaccharides * overproduces amino acids
|
|
|
Genome reduction |
E. coli - 4.6 million H. salinarum - 2.57 million HTCC2181 - 1.3 million Mycoplasma genitalium - 580 thousand Hodgkinia cicadicola - 143 thousand |
|
|
Smallest genome: free-living organisms |
Pelabiacter ubique (1.3 million genome)
* discovered in Sargasso sea * up to 50% of cells in temperate water * important in carbon cycle PHOTOSYNTHETIC |
|
|
Biggest genome: Myxobacteria |
Sorangium cellulosum (13 million genome)
* displays cellular differentiation (fruiting bodies) * can remotely sense objects * hunt prey in coordinated attack |
|
|
Open Reading Frame (ORF) |
Searching for information
transcriptional start - promoter Shine-Dalgarno - AGGA) Start codon - ATG Sense codon - (XXX)n Stop codon - TAA
Can be in either orientation ORFs usually contain at least 100 codons (300 bp) |
|
|
ORFs in bacterial genomes |
Highest percent of ORFs in DNA replication, translation
Lowest percent of ORFs in energy generation, signal transduction, transcription
|
|
|
Re-constructed genome map |
* Outer circle = MBp designation; 0 is origin of replication *Second ring = tRNA genes in BLUE; single rRNA operon in ORANGE *Third ring = clockwise ORFs in DARK GREEN; counterclockwise ORFs in LIGHT GREEN *Fourth ring = IS elements of repetitive DNA in ORANGE *Inside sunburst = G+C content = YELLOW RAYS less than 65%; ORANGE RAYS more than 65% |
|
|
Gene annotation |
*compare ORF sequence to databases
*similar sequence annotated as having similar function
*use to reconstruct metabolic pathways |
|
|
Genes help determine function |
*pathogens use growth factors from host cells
*genome showed pathway for metabolism (T. maritima)
*showed ORFs of unknown function (URF) e.g E. coli 38% URFs
*Offer hypotheses NOT PROOF of pathways |
|
|
Gene expression in prokaryotes |
Start = promoter code
Stop = terminator code
Allow RNA polymerase to create SINGLE mRNA TRANSCRIPT |
|
|
Polycistronic mRNA |
ONE transcript encode MULTIPLE polypeptides
ORFs separated by STOP CODONS
INTERCISTRONIC regions of VARYING length |
|
|
COUPLED TRANSCRIPTION / TRANSLATION |
= RAPID REGULATION
= Polysomes |
|
|
Significance of gene regulation 1 |
*Microbes must respond immediately to environmental changes
- chemotaxis - move to fuel or light - facultative aerobes - switching from O2 to alternate electron acceptor - temperature changes - increase or decrease levels of unsaturated fatty acids in membranes |
|
|
Significance of gene regulation 2 |
* Symbiosis or Pathogenesis
- EXPRESS virulence factors to establish INFECTION
- EXPRESS genes to establish SYMBIONT-HOST relationship |
|
|
Ways to regulate activity |
* CONSTITUTIVE expression = NO CONTROL * POSTTRANSLATIONAL expression = * TRANSLATIONAL expression = NO PROTEIN SYNTHESIS * TRANSCRIPTIONAL expression = NO mRNA SYNTHESIS
|
|
|
Gene CATEGORIES based on REGULATION |
CONSTITUTIVE = housekeeping = no regulation, expressed continously
REPRESSIBLE = repressed when product not needed = enzyme DOWN in presence of REPRESSOR AND CO-REPRESSOR
INDUCIBLE = expressed only when needed = enzyme UP in presence of REPRESSOR AND INDUCER |
|
|
Transcriptional regulation in Prokaryotes 1 |
OPERON = controls synthesis of several proteins
STRUCTURAL GENE = encode polypeptide
OPERATOR (O) = starts/halts by binding protein factors
PROMOTER (P) = binds RNA polymerase for transcription
REGULATOR (Reg) = encodes single protein - this binds to O to control gene expression ("effectors") |
|
|
Transcriptional regulation in Prokaryotes 2 |
NEGATIVE: block mRNA synthesis - too much enzyme - activity no longer needed - "repressor protein" to bind to DNA to
POSITIVE: stimulate mRNA synthesis - more enzyme needed - "activator protein" to bind DNA to PROMOTE transcription |
|
|
NEGATIVE CONTROL: ENZYME REPRESSION
SHUTTING DOWN THE ENZYME |
*have presence of repressor but transcription goes
*add co-repressor (e.g. arginine) that binds repressor
*the complex binds O and blocks arginine synthesis |
|
|
NEGATIVE CONTROL: ENZYME INDUCTION
TURNING ON THE ENZYME |
*REPRESSOR bound at O of lac operon in presence of glucose - lactose metabolism genes turned off
*when glucose gone, INDUCER binds to REPRESSOR, removing it from lac operon
*lactose metabolism genes now transcribed
|
|
|
POSITIVE CONTROL |
*ACTIVATOR protein PROMOTES binding of RNA polymerase to promoter
*several NON-CONTINUOUS operons involved
*INDUCER molecule REQUIRED for activator to bind to DNA (e.g. maltose) |
|
|
CATABOLITE REPRESSION |
*E. coli can use several sugars BUT HAS PREFERENCE
*CATABOLITE repression - expression of genes for other sugars REPRESSED due to lack of CATABOLITE (cAMP)
*DIAUXIC GROWTH - preferred sugar 1st - then gene for 2nd sugar turned ON
*LAG during switch = BIPHASIC growth curve |
|
|
lac OPERON REGULATION
POSITIVE / NEGATIVE CONTROL
CAP = catabolite activator protein |
*CAP binds cAMP
*CAP-cAMP binds UPSTREAM - increase RNA polymerase binding at P
*transcription begins
*LACTOSE as INDUCER to remove REPRESSOR bound at O (repressor coded by lacl gene) |
|
|
SUMMARY OF lac OPERON REGULATION 1 |
*Lactose NO glucose present
REPRESSOR inactive = BINDING of RNA polymerase to P = TRANSCRIPTION OCCURS
*Lactose AND glucose present
cAMP levels too low to activate CAP = TRANSCRIPTION INHIBITED |
|
|
SUMMARY OF lac OPERON REGULATION 2 |
*NEITHER lactose NOR glucose present
BOTH activator AND repressor are active = TRANSCRIPTION INHIBITED BY REPRESSOR
*Glucose BUT NO lactose
NO CAP, lots of repressor = TRANSCRIPTION+ INHIBITED |
|
|
CAP IS A GLOBAL REGULATOR |
*regulates several OPERONS using different CATABOLITES
*arabinose, galactose, maltose (other carbons)
*OPERONS under NEGATIVE regulator control
*FEATURES differ but BINDING CAP/cAMP is SAME |
|
|
GLOBAL CONTROL SYSTEMS |
*REGULON = multiple OPERONS but common REGULATORY PROTEIN
*Allows quick adjustment to surroundings
*Alternate SIGMA factors of RNA polymerase = GLOBAL EFFECTS - cellular differentiation = SPORULATION - temp changes = HEAT SHOCK - increase osmolarity = COMPATIBLE SOLUTES MEMBRANE |
|
|
E. COLI REGULONS - 1 |
Aerobic respiration
Signal = positive O2
Primary activity = Repressor (ArcA)
Number of genes = 50+ |
|
|
E. COLI REGULONS - 2 |
Anaerobic respiration
Signal = negative O2
Primary activity = Activator (FNR)
Number of genes = 70+ |
|
|
E. COLI REGULONS - 3 |
Catabolite repression
Signal = concentration of cAMP
Primary activity = Activator (CAP)
Number of genes = 300+ |
|
|
E. COLI REGULONS - 4 |
Heat shock
Signal = temperature
Primary activity = sigma 32
Number of genes = 36 |
|
|
E. COLI REGULONS - 5 |
Nitrogen utiliation
Signal = negative NH3 (ammonia)
Primary activity = Act NRI / sigma 54
Number of genes = 12+ |
|
|
E. COLI REGULONS - 6 |
Oxidative stress
Signal = Oxygen radical
Primary activity = Activator (OxyR)
Number of genes = 30+ |
|
|
E. COLI REGULONS - 7 |
SOS response
Signal = Damaged DNA
Primary activity = Repressor (LexA)
Number of genes = 20+ |
|
|
"OMICS" A.K.A. "POST-GENOMICS" |
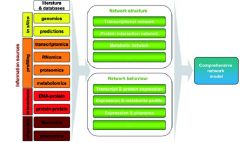
Literature/databases + Network structure + Network behavior = Comprehensive network model
|
|
|
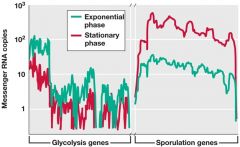
STUDIES OF GENE EXPRESSION: cDNA |
REVERSE TRANSCRIPTASE = retrovirus enzyme
Produces DNA genome copies = cDNA
Integrate into host DNA
Total mRNA extracted to see differences - cells under different growth conditions - wild-type versus mutant cell lines |
|
|
MICROARRAYS: DETECTING DIFFERENTIAL GENE EXPRESSION - 1 |
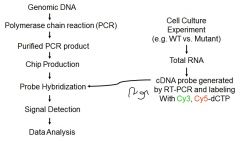
Creation of microarray
Creation of labeled probe = all mRNA present in cell at time |
|
|
MICROARRAYS: DETECTING DIFFERENTIAL GENE EXPRESSION - 2 |
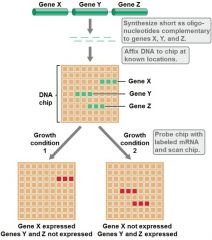
Labeled probe goes to complementary seq on array
Hybridizes by bp rules (A:T & G:C)
Detected by fluorescent signal |
|
|
MICROARRAY DATA |
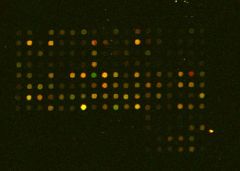
GREEN = wild-type only RED = mutant only YELLOW = in both cells |
|
|
TRANSCRIPTOME OF P. AERUGINOSA |
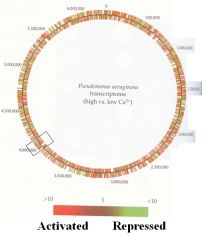
Global gene expression from cells grown in high vs low Ca2+ |
|
|
RNA - Seq |
*Next gen sequencing *NO MICROARRAY *DIRECTLY sequence *QUANTIATIVE copy |
|
|
PROTEOMICS: DETERMINING DIFFERENCE IN TRANSLATION |
PROTEOME = all proteins present in cell, tissue or organism at one time
*Extract proteins *Separate on 2-D gel *Compare spots *Extract and sequence to identify |
|
|
METABOLOMICS: DIFFERENCE IN METABOLISM |
METABOLOME = complete set of metabolic intermediates + small molecules produced
COMPLICATED analysis - WIDE diversity of properties of metabolites |
|
|
SYSTEMS BIOLOGY |
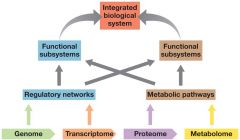
INTEGRATION OF DIFFERENT FIELDS
=
OVERVIEW OF ORGANISM
|
|
|
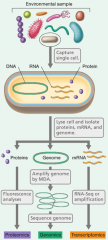
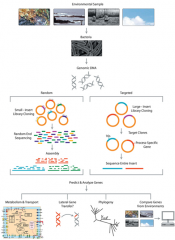
SINGLE CELL GENOMICS |
|
|
|
METAGENOMICS |
|
|
|
COMPARATIVE GENOMICS AND MOLECULAR EVOLUTION |
|
|
|
ELEMENTARY EVOLUTIONARY FORCES |
* gene DUPLICATION * gene LOSS * gene ORDER CONSERVATION & REARRANGEMENT of genes * nucleotide SUBSTITUTION (recomb & mutation) * HORIZONTAL GENE TRANSFER |
|
|
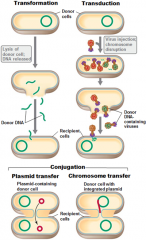
HORIZONTAL GENE TRANSFER |
|
|
|
EVOLUTION BY REDUCTION |
Parasites/pathogens = adapt to host cell environment
Lose genes not essential for life within host
High fraction of pseudogenes within genomes |
|
|
GENE LOSS -1 |
*Genomes not getting bigger *Acquire foreign DNA balanced by native gene loss *DELETIONAL BIAS = MAJOR SHAPING FORCE |
|
|
GENE LOSS - 2 |

(same pic as for 1) *No longer beneficial *Strong selection (accumulating mutations) *Gene decay = pseudogene = loss |
|
|
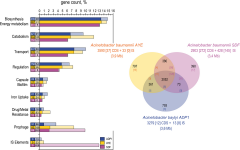
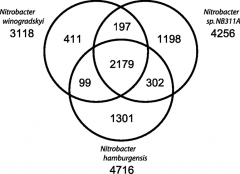
PAN GENOME VERSUS CORE GENOME - 1 |
CORE = shared by all strains of species
PAN = all genes found in a group, even if not in all strains |
|
|
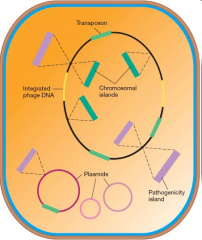
PAN GENOME |
INCLUDE:
* Transposons * Plasmids * Phage (viral) DNA * Chromosomal islands * Pathogenicity islands |
|
|
PAN GENOME VERSUS CORE GENOME - 2 |
|
|
|
EVOLUTION OF VIRULENCE - 1 |

Chromosomal islands
- horizontal transfer - flanked by inverted repeats - G+C different from rest |
|
|
EVOLUTION OF VIRULENCE - 2
Virulence Factors = VF |
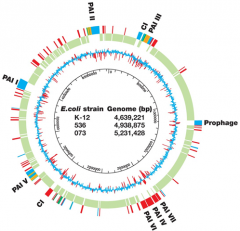
Pathogenicity islands
- blocks of genes encode VF - RED genes = only in pathogenic strain |
|
|
who has the biggest genome and why?
|
humans are 1000x bigger but only have six times the genes as proks
free living > obl parasites > obl symbio |