![]()
![]()
![]()
Use LEFT and RIGHT arrow keys to navigate between flashcards;
Use UP and DOWN arrow keys to flip the card;
H to show hint;
A reads text to speech;
37 Cards in this Set
- Front
- Back
|
What do the mean? |
The average of the data values. |
|
|
What is the symbol for data values? |
X |
|
|
What is the symbol for # of all data values? |
n |
|
|
What is the symbol for mean? |
|
|
|
What is the median? |
The midpoint of the data, 1/2 of data is below and 1/2 data is above. |
|
|
What is the mode? |
The # that shows up the most. |
|
|
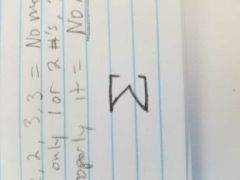
Can there be 3 modes? |
No, only 1 or 2 modes. |
|
|
If there isn't a mode how is it expressed? |
With words: No Mode. |
|
|
What is the Rounding Rule? |
Raw data is rounded to the first decimal place in ALL answers. |
|
|
What is the Range? |
The difference between the max and min in a data set. |
|
|
What us the Variance? |
The average discrepancy between points. |
|
|
What's is the Standard Deviation? |
The average variation of data values from the mean. |
|
|
How do you create a table in the calculator? |
STAT, Enter |
|
|
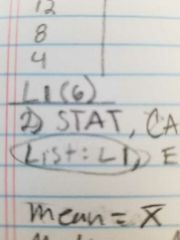
In a calculator, how do you find the tables info? |
STAT, CALC, 1-var stats, Enter x3 |
|
|
In a calculator, how do you find the mean? |
|
|
|
In a calculator, how do you find the Median? |
Med |
|
|
In a calculator, How do you find the mode? |
1. Sort the table: STAT, SortA, Sort A (2nd, 1), Enter 2. Count how many of each # |
|
|
In a calculator, How do you find the Range? |
maxX - minX = Range |
|
|
In a calculator, How do you find the Standard Deviation? |
Sx |
|
|
In a calculator, How do you find the Variance? |
Sx × Sx |
|
|
How do you clear a list? |
Go to L1, Clear, Enter |
|
|
In a bell curve problem, what is the symbol for the mean? |
|
|
|
In a bell curve problem, what is the symbol for the Standard Deviation? |
s |
|
|
In a bell curve problem, what is the formula for the minimum? |
x-3s |
|
|
In a bell curve problem, what is the formula for the maximum? |
x+3s |
|
|
What is the formula and where do you color if x>280? |
P(x>280), to the right of 280 |
|
|
What us the formula and where do you color if x<320? |
P(x<320), Left of 320 |
|
|
How do you find the area under the curve in a calculator? |
2nd, VARS, 2, put in the lower, upper, mean, standard Deviation, Enter Write the decimal than find the percentage by moving the decimal 2 places and rounding to 4 digits. |
|
|
In a calculator, what is the lower and upper in this problem: P(17<x<72)? |
Lower: 17 Upper:72 |
|
|
What is the formula for "between 67 and 89"? |
P(67<x<89) |
|
|
On a bell curve, where is the midpoint and what is it? |
The mean, its the highest point. |
|
|
In a Histogram what is the X and Y Axis? |
X=UPPER CLASS LIMITS Y=FREQUENCY |
|
|
In a Frequency Polygon, what is the X and Y Axis? |
X=MIDPOINTS, Y=FREQUENCY |
|
|
In a Cumulative Frequency Polygon, what is the X and Y Axis? |
X=UPPER CLASS LIMITS, Y=CUMULATIVE FREQUENCY, |
|
|
AREA BELL GRAPH: what 3 numbers do you need to find the cutoff area? |
Area, Mean, standard deviation. |
|
|
AREA BELL GRAPH: if your trying to find the area of the Top 15% What area do you enter in the calculator? |
.85 |
|
|
AREA BELL GRAPH: How do you enter the invNorm in a calculator? |
2nd, VARS, 3. |