Reading...
![]()
Play button
![]()
Play button
![]()
Use LEFT and RIGHT arrow keys to navigate between flashcards;
Use UP and DOWN arrow keys to flip the card;
H to show hint;
A reads text to speech;
61 Cards in this Set
- Front
- Back
|
Define statistics.
|
Statistics is the art and science of collecting, analyzing, presenting, and interpreting data. Statistics has wide application in business, including the fields of accounting, finance, marketing, production, economics, and information systems.
|
|
|
Define the term "data".
|
Data are the facts and figures (numbers, words, and symbols) collected, analyzed, and summarized for presentation and interpretation.
|
|
|
Define the term "data set".
|
All the data collected in a particular study are referred to as the data set for the study.
|
|
|
Define the term "element".
|
Elements are the entities on which data are collected (e.g., nations in the World Trade Organization, 60 nations, 60 elements). The values in column 1 of a table.
|
|
|
Define the term "variable".
|
A variable is a characteristic of interest for the elements (e.g., age, height and weight might be elements for an individual). The cells of all columns except column 1 (the elements).
|
|
|
Define the term "observation".
|
The set of measurements (data within the variables) obtained for a particular element is called an observation. The values entered in a particular row in all columns except column 1 (the element name).
|
|
|
How can you determine the total number of data items in a data set without counting?
|
The total number of data items can be determined by multiplying the number of observations by the number of variables.
|
|
|
Name the different "scales of measurement".
|
Scales of measurement:
Nominal (named attribute, limited range, no rank) Ordinal (named attribute with rank ordered) Interval (numeric data, fixed unit, e.g., car year) Ratio (numeric data, ratio of measurement is important, e.g., length is ratio from starting point) |
|
|
What two categories are used to classify data?
|
Data can be classified as either categorical or quantitative.
|
|
|
Define the different "scales of measurement" for qualitative data.
|
Nominal scale – data consist of labels or names used to identify an attribute of the element, a numerical code as well as a non-numeric label may be used
Ordinal scale – data exhibit the properties of nominal data and in addition, the order or rank of the data is meaningful (e.g., AAA to F credit rating) |
|
|
Define the different "scales of measurement" for quantitative data.
|
Interval scale – data have all the properties of ordinal data and the interval between values is expressed in terms of a fixed unit of measure, always numeric (e.g., college entrance SAT scores)
Ratio scale – data have all the properties of interval data and the ratio of two values is meaningful, variables such as distance, height, weight, and time use the ratio scale of measurement, requires a zero value where nothing exists for the variable at the zero point |
|
|
Which scales of measurement are used for categorical data?
|
Nominal or ordinal scale.
|
|
|
Which scales of measurement are used for quantitiative data?
|
Interval or ratio scale.
|
|
|
Which types of data can only be summarized?
|
Categorical data.
|
|
|
Which type of data may be discrete or continuous? Define the terms "discrete" and "continuous" with regard to data.
|
Quantitative data is discrete or continuous. Quantitative data that measure how many (e.g., number of calls received in x time) are discrete. Quantitative data that measure how much (e.g., weight or time) are continuous because no separation occurs between the possible data values.
|
|
|
What is the difference between cross-sectional data and time series data?
|
Cross-sectional data are data collected at the same or approximately the same point in time. Time series data are data collected over several time periods.
|
|
|
How can statistical studies be classified? Define each class.
|
Statistical studies can be classified as either experimental or observational. In an experimental study, a variable of interest is identified; then one or more other variables are identified and controlled so that data can be obtained about how they influence the variable of interest. Observational statistical studies (non-experimental) make no attempt to control the variables of interest (e.g., a survey).
|
|
|
What are data with unusually large or small values called?
|
Outliers.
|
|
|
What is meant by the term "descriptive statistics"?
|
Data summarized and presented in a form that is easy for the reader to understand, which may be tabular (table), graphical, or numerical (most common is mean).
|
|
|
What is meant by the term "statistical inference"?
|
Statistical inference involves the use of a sample of a population to make estimates and test hypotheses about the characteristics of a population.
|
|
|
What is the difference between a "population" and a "sample"?
|
A population is the set of all elements of interest in a particular study. A sample is a subset of the population. A census collects data for the entire population; collect data for a sample is called a sample survey.
|
|
|
What is the difference between a "training data set" and a "test data set"?
|
. Finding a statistical model that works well for a particular sample of data does not necessarily mean that it can be reliably applied to other data. One of the common statistical approaches to evaluating model reliability is to divide the sample data set into two parts: a training data set and a test data set. If the model developed using the training data is able to accurately predict values in the test data, we say that the model is reliable.
|
|
|
List some forms of unethical behavior with regard to statistics.
|
Improper sampling (e.g., running multiple tests to get the desired results), inappropriate analysis of the data, development of misleading graphs, use of inappropriate summary statistics, and a biased interpretation of the statistical results.
|
|
|
What is another name for categorical data?
|
Qualitative
|
|
|
What is a "frequency distribution"?
|
A frequency distribution is a tabular summary of data showing the number (frequency) of observations in each of several non-overlapping categories or classes (the sum of all frequencies in a distribution equals the number of observations).
|
|
|
What is the relative frequency and how is it calculated?
|
The relative frequency of a class equals the fraction or proportion of observations belonging to a class. For a data set with n observations, the relative frequency of each class can be determined as follows:
Relative frequency of a class= (Frequency of the class)/n |
|
|
The sum of all relative frequencies always equals _________?
|
One.
|
|
|
True or False: For categorical data, the bars on bar charts should be separated.
|
True. The bars should be separated to emphasize the fact that each category is separate.
|
|
|
What is a "Pareto Diagram"?
|
A bar chart identifying the most important causes of a problem with the bars arranged in descending order of height from left to right (most frequent cause first).
|
|
|
Is a frequency distribution used for qualitative or quantitative data?
|
Both.
|
|
|
What is the difference between a "frequency distribution" and a "cumulative frequency distribution"?
|
Cumulative frequency distributions use the number of classes, class widths, and class limits developed for a frequency distribution, but rather than showing the frequency of each class, they show the number of data items with values less than or equal to the upper class limit (data becomes cumulative). The last entry in a cumulative frequency distribution always equals the total number of observations.
|
|
|
What does a "dot plot" summarize?
|
Frequency distribution. Dot plots show the details of the data and are useful for comparing the distribution of the data for two or more variables.
|
|
|
What does a "histogram" summarize?
|
Frequency, relative frequency, or percent frequency. Histograms provide information about the shape, or form, of a distribution.
|
|
|
True or False: The bars on a histogram should be separated.
|
False. The bars touch to indicate there is no space between them.
|
|
|
Define "skewness" with regard to a histogram?
|
Skewness refers to the shape of the histogram and the "tail" extending in one direction or the other. Histograms can be symmetric (no tail), or either highly skewed or slightly skewed to the left or to the right. The direction the tail points indicates left or right.
|
|
|
What are the steps for developing a frequency distribution?
|
1. Determine number of classes (typical is 5 to 20)
2. Determine width of classes (range/number of classes) 3. Set class limits (may round, trial and error) 4. Tabulate the data |
|
|
What does a "stem-and-leaf" display summarize?
|
A stem-and-leaf display is used to show simultaneously the rank order and shape of a distribution of data. For leaf values greater than one, the data is truncated.
|
|
|
Define the term "point estimator".
|
Sample statistics are referred to as point estimators of the corresponding population. Sample statistics are computed for data from a sample.
|
|
|
Define the term "population parameter".
|
A statistic computed from data for an entire population.
|
|
|
Define the arithmetic mean and write out the formula for calculating the mean for a sample and a population.
|
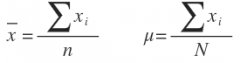
The mean is the average value for a variable. If the data are for a sample, the mean is denoted by x-bar; if the data are for a population, the mean is denoted by the Greek letter µ.
|
|
|
What issue is there with the mean as a measurement of location?
|
Each observation, xi, is given the same weight, specifically 1/n. The mean can be influenced by extreme values. It is better to use the median than the mean as a measure of central location when a data set contains extreme values. A “trimmed mean” may be used by deleting a percentage of the smallest and largest values from a data set before computing the mean.
|
|
|
Define the term "median" and state how it is calculated.
|
Another measure of central location, the median, is the value in the middle when the data are arranged in ascending order. For an odd number of observations, the median is the middle value. For an even number, the median is the average of the two middle values. In some situations the median is preferred to the mean. The mean can be influenced by extreme values.
|
|
|
Define the term "mode" and state how it is calculated.
|
The mode is the value that occurs with greatest frequency. The greatest frequency can occur at two or more different values and more than one mode can exist; two modes are bimodal, or the data is multimodal. Multimodal data is almost never reported because listing three or more modes would not be particularly helpful in describing a location for data.
|
|
|
Define the term "percentile".
|
A percentile provides information about how the data are spread over the interval from the smallest value to the largest value (e.g., value x was in the 70th percentile). The “pth percentile” divides the data into two parts, approximately p percent of the observations have values less than pth percentile; and approximately (100 – p) percent of the observations have values greater than the pth percentile. Note that the 50% percentile is also the median.
|
|
|
State how a percentile is calculated.
|
Arrange the data in ascending order. Compute an index: i= (p/100)n
If i is not an integer, round up; the next integer greater than i denotes the position of the pth percentile If i is an integer, the pth percentile is the average of the values in positions i and i +1 |
|
|
Define the term "quartile".
|
Quartiles divide the data into four parts with each part containing approximately 25% of the observations. Use the same process as for percentiles at the following marks: Q1 = first quartile, or 25th percentile, Q2 = second quartile, or 50th percentile (also the median), Q3 = third quartile, or 75th percentile. Quintiles (20th, 40th, 60th, 80th) and deciles (10th, 20th, etc.) are also used.
|
|
|
Define the term "range" and state how it is calculated.
|
Range is the simplest measure of variability, but seldom used as the only measure. Range is based on only two of the observations and is highly influenced by extreme values (outliers).
Range=Largest Value-Smallest Value |
|
|
Define the term "interquartile range" and state how it is calculated.
|
The interquartile range is the difference between the third quartile, Q3, and first quartile, Q1. It is used to overcome the dependency on extreme values and often for checking for outliers.
IQR= Q3-Q1 |
|
|
Define the term "variance".
|
The variance is a measure of variability based on the difference between the value of each observation and the mean. It utilizes all of the data and the units are the original unit squared (e.g., dollars squared). The difference between each xi and the arithmetic mean (x-bar or µ) is called a deviation about the mean
(it is xi – x-bar, or xi – µ). In the variance, the deviations about the mean are squared. |
|
|
State how to calculate variance.
|
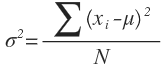
For a population variance, σ2, where N is the number of observances. Note s^2, x-bar, and n for sample.
|
|
|
Define the term "standard deviation".
|
The standard deviation is defined to be the positive square root of the variance, notated by s or σ. It is the typical distance you would expect between a piece of data and the mean. It therefore describes the spread in the data. The larger the standard deviation, the more spread out the data is. The smaller the standard deviation, the less spread out the data is.
|
|
|
State how the standard deviation is calculated.
|
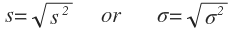
The standard deviation is the positive square root of the variance.
|
|
|
Define the term "coefficient of variation".
|
The coefficient of variation indicates how large the standard deviation is relative to the mean and is normally expressed as a percentage.
((Standard Deviation)/Mean x 100)% |
|
|
If data is said to have a negative skewness, which direction is the tail pointing?
|
Left
|
|
|
For data skewed to the right, is the mean higher or lower than the median?
|
The mean will usually be greater than the median. The extreme values in the tail pull the mean.
|
|
|
Define the term "z-score".
|
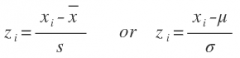
The relative location of an observation relative to the mean, expressed in the number of standard deviations from the mean. Also known as the "standardized value". Positive z-scores are greater than the mean, negatives are lower. Zero is equal to the mean.
|
|
|
State Chebyshev's Theorem and describe its use.
|
At least (1 – 1/z^2) of the data values must be within z standard deviations of the mean, where z is any value greater than 1. The theorem can be used to make statements about the proportion of data values that must be within a specified number of standard deviations of the mean.
|
|
|
State the Empirical Rule and describe its use.
|
When data sets exhibit symmetric mound-shape or bell-shape distribution, the empirical rule can be used to determine the percentage of data values that must be within a specified number of standard deviations of the mean.
68% for one standard deviation of the mean 95% for two standard deviations 99.7% (almost all) within three standard deviations |
|
|
Define the term "outliers" and state how they are determined.
|
Observations with unusually large or unusually small values are called outliers. Outliers should be identified and reviewed to determine if they are errors that need to be corrected, though some outliers do belong in the data set and should remain. Two approaches:
Any data value with a z-score less than –3 or greater than 3 should be examined as an outlier. The values of the first and third quartiles and the interquartile range can also be used to identify outliers. Multiply the range by 1.5 and subtract it from Q1 and add it to Q3. |
|
|
Define the term "five-number summary".
|
Five numbers are used to summarize data (in order):
1. Smallest Value 2. First Quartile (Q1) 3. Median (Q2) 4. Third Quartile (Q3) 5. Largest Value Approximately one-fourth, or 25%, of the observations are between adjacent numbers in a five-number summary. |
|
|
Define the term "box plot" and describe its construction.
|
A box plot is a graphical summary of data that is based on a five-number summary. A key to the development of a box plot is the computation of the interquartile range, IQR = Q3 – Q1. The steps for constructing a box plot are:
1. A box is drawn with the ends of the box located at the first and third quartiles. This box contains the middle 50% of the data. 2. A vertical line is drawn in the box at the location of the median. 3. By using the interquartile range, IQR = Q3 – Q1, limits are located at 1.5(IQR) below Q1 and above Q3. Data outside of these limits are considered outliers. These lines are typically not drawn on the box plot. 4. “Whiskers” are drawn with dashed lines from the ends of the box to the smallest and largest values inside the limits. 5. The location of each outlier is shown with an asterisk. |