![]()
![]()
![]()
Use LEFT and RIGHT arrow keys to navigate between flashcards;
Use UP and DOWN arrow keys to flip the card;
H to show hint;
A reads text to speech;
108 Cards in this Set
- Front
- Back
|
Definition of Marketing |
Managerial and social PROCESS by which individuals and organizations obtain what they need and want through creating, offering and exchanging products of VALUE with others |
|
|
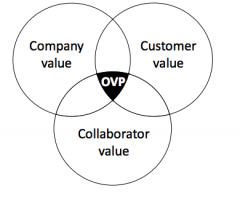
Value: 3 V's |
Company value = profit and loss Customer value= functional, psychological, Monetary Collaborator value = (retailer P&L) |
|
|
Company value |
P&L Net Revenue -COGS -ADvertising budget (promotion and research) = Marketing contrbution -Overheads, other fixed costs =Operating profit |
|
|
Attributes of a good business goal |
with enough money, driving the top line is easy (revs) The real challenge for a marketing manager is generating “profitable revenues”.Thus, a business goal expressed in terms of Marketing Contribution makes the mostsense to drive sound marketing decisions. |
|
|
Customer value: functional |
benefits and costs directly related to anoffering’s performance.T functionality reliability, durability, design, ease of use,form, style, packaging, technology, etc |
|
|
Customer value: psychological |
Mental benefits / costs influenced by the emotional needsan offering satisfies, -safety, status,respect, belonging, esteem, etc. |
|
|
Customer value: monetary |
The monetary value of an offering is typicallyinfluenced by its price, cost of ownership,fees, etc. Although for a customer monetary value istypically related to costs, an offering can alsobe provide monetary benefits such asbonuses, prizes, discounts, rewards, etc. |
|
|
__________ are often the most important collaborators |
retailers |
|
|
Optimum value proposition |
|
|
|
Name the five C's Which one is in the middle of the circle? |
Customers = middle Competitors Context Collaborators Company |
|
|
Marketing strategy |
Marketing Strategy involves developing aunique value proposition by: • Identifying target customers(segmentation and targeting) • Differentiating the company’s offeringfrom competitors’ offerings(positioning) |
|
|
Marketing Tactics
1 secret 5th P in the middle |
Products - Designing Value Price - Capturing value Promotion - Communicating value Placement - Delivering value |
|
|
5 C's: Which are internal which are external? |
Internal = company External = competitors, context, collaborators, customers |
|
|
Market Definition and sizing: Discuss need-based vs product based |
Need based comes first. Is essential for long term strategic planning. . A broad market definition centers on the needs customers are trying tosatisfy, rather than on the products companies sell. Then, narrow it down with product based definition. Short term |
|
|
How to quantify market potential |
After a market definition has been established, it is crucial to try to estimate the potentialsize of the market. The potential market should be estimated both in terms of maximumnumber of customers, maximum number of units that can be sold and maximum revenuethat can be earned |
|
|
How to quantify current market |
The current market should bemeasured both in terms of current number of customers, current number of units sold andcurrent revenue earned. The larger thedifference between potential and current market, the larger the opportunity to grow,hence the attractiveness of the market. |
|
|
Absolute growth vs growth rate |
Absolute growth= (Value at time t) - (Value at t-1) GrowRate = [(Value at time t) - (Value at t-1)]/(Value at time t) |
|
|
Market share |
Expressed in sales: or revenue Market share = (Product Sales) / (total market sales) X 100 |
|
|
Relative market share |
Brand sales / largest competitor sales |
|
|
BCG Matrix |
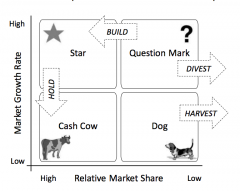
For individual brand analysis, is far from perfect |
|
|
Strategic assets |
resources (e.g. brands, real estate, R&Dfacilities, deep pockets, etc.) that are core for a company’s ability to provide value to itscustomers, in a way that strategically differentiate it from its competitors (i.e. create acompetitive advantage). - Brands- Existing Customer Base- Human Capital- Intellectual Property- Collaborator Networks- Access to Scarce Resources- Access to Capital |
|
|
Core competencies |
Core competencies are skills (e.g. knowledge, technologies, processes, know-how, etc.)that are central to a company’s ability to provide value to its customers, differentiate it from its competitors 1) VALUABLE: it has a unique impac (2) DIFFICULT TO IMITATE: (3) EASY TO LEVERAGE: it can be widely leveraged across many products and markets |
|
|
Always define core competencies in terms of ... |
VALUE …specific skills, knowledge and activities should be just a manifestation of a core competence defined in terms of value |
|
|
Be careful of ... |
Core Rigidities are former core competencies that sow the seeds oforganizational inertia and prevent the firm from responding appropriately tochanges in the external environment• Strategic myopia and inflexibility can strangle the firm’s ability to adapt toenvironmental change and anticipate competitive threats |
|
|
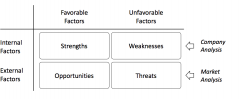
SWOT Analysis |
|
|
|
Two ways to identify competition: |
Product vs. Need (Based) The most appropriate way to think about competitors is the need-based approach.This is because customers don’t buy products, they “hire products to perform a job,” |
|
|
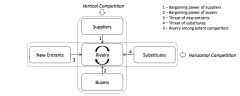
Porter's competitive intensity graphic |
|
|
|
5 C'S .... Context |
PEST Political and legal trends Economic Trends Socio-cultural trends Technological Trends |
|
|
Where do we start a brands performance analysis |
Sales Data 1. track sales of our specific products (e.g. “How much are we selling?” “Are our salesincreasing, decreasing, staying the same?”)2. track sales of competing products (e.g. “How are our sales doing compared to ourcompetitors?” “What is our market share”)3. track sales of the overall market (e.g. “What is the size of the total category?” “Isthe category expanding, shrinking, or staying the same?”) |
|
|
Sell in vs. Sell out |
most companies don’t sell their products directlyto the final consumers, but to intermediaries(e.g. wholesalers, retailers). Thus, they know howmuch, when, and at what price they shippedproducts to each intermediary (sell-in), but donot know how much, when and at what priceintermediaries sold the products to finalconsumers (sell-out). |
|
|
Retail data. Its categories and why its awesome |
Retail data = Sell out data Store data vs Shopper data This is because retail sales data reflects actual behavior. It measureswhat consumers purchased at a certain time, in a particular store, under a particular set ofcompetitive conditions. |
|
|
Store data |
Point of sale. The defining characteristic of POS data is that it records all transactions that occur in a storeover an certain period of time. This data consist of weekly pricing, volume, and storeenvironment information |
|
|
Shopper Data |
Panel -> Neilsen linked to an individual or a household Panel data is tied to individual buying households. With panel data, you can look at theconsumer dynamics underlying your sales patterns. Panel data can tell you thedemographics of your buyers, how often they buy, how loyal they are, and what otherproducts they purchase. It’s sometimes referred to as “household data”. |
|
|
Syndicated date |
Sold by Neilsen, IRI and SPINS Both Store (POS) and Shopper (Panel) Syndicated data provides a complete pictureof the market, as it captures sales of almostall products in almost all stores in a certaingeography. You can see how your brand andcompeting brands sell in different retailers. |
|
|
Syndicated store data |
POS data is the first thing most managers purchase from Nielsen or IRI. Both manufacturersand retailers purchase this data from Nielsen or IRI.Because manufacturers know sell-in but not sell-out, sell-out information by recording POS data.Because retailers don’t know what sells in other retailers, Nielsen and IRI provide retailerswith sales information in other retail channels by recording POS data across different retailers.Volume, distribution, price and promotion are the focus. |
|
|
Analyzing sales data |
Hows the category? How are we? HOW MUCH Sales in dollars, units, volume time period, geography, retail channel |
|
|
Calculate an index |
Index = (Value / baseline ) * 100 |
|
|
Seasonality index |
Step 1: Calculate average sales ($, units, volume) across all time periods of interest Step 2. divide each time period by Step 1 x 100 Seasonality Index = (Sales / Average Sales ) * 100 Plotting makes it easier to visualizes sales fluctuations over the year |
|
|
How to understand how sales are trending |
compare performance across multiple time periods |
|
|
Absolute vs. Relative ∆ in sales |
Absolute change = (Value at time t) - (Value t-1) Relative (%) change = (Value at time t) - (Value t-1) ------------------------------------------- * 100 Valut at time t-1 |
|
|
looking at WHERE stoof is getting purchased |
retail channels (or outlets) -tyrpically provided by Nielsen or IRI ex. Grocery Mass Club Drug Convenience (SALES performance varies drastically on geography) Military |
|
|
Drivers of sales performance |
Base vs. incremental Distribution Price Promotion |
|
|
Base vs. Incremental sales |
Incremental sales: Sales due to the presence of retailer merchandising activities Base Sales: Sales which would occur when no retailer merchandising activity is present Total = Base + Incremental |
|
|
Three types of promotional activities at retail |
Display - sign in store Feature - circulars, coupon books, Instore flyers Temporary price reduction (at least 5%) Often display and TPR happen simulataneously |
|
|
How do we calculate base sales? |
Base sales are a fugazi. • Base sales are not “real” sales, but rather a statistically calculated measure. Base sales arecalculated using an IRI/Nielsen proprietary statistical “smoothing” model that factors outstore-level promotion effects, primarily by projecting volume sold during weeks when nopromotion is running to weeks during which promotions are running. |
|
|
Calculate base sales (steps) |
1.) identify promoted weeks 2.) exclude promoted weeks -> calculate a best-fit baseline 3.) Re-insert the promoted weeks to look at the incremental sales |
|
|
How should we look at incremental sales? |
Both in units and in dollars because sometimes they can provide conflicting insights. Incremental Unit Sales can never be less than 0. However, Incremental Dollar Sales canbe negative. This happens when not enough promoted units were sold to make up for theprice reduction offered with the promotion. |
|
|
Drivers of base sales (5) |
Distribution Competition Macro environment Advertising Regular price |
|
|
Drivers of incremental sales (5) |
Distribution on promotion length of promotion competitors Type of promo Price of promo |
|
|
UNDISPUTED KING DRIVER OF SALES PREFORMANCE |
Distribution BABY Distribution is a measure of availability (i.e. whether the product is actuallyavailable on retailers’ shelves).!Monitoring distribution allows to answer fundamental competitive questions, such as:1. How does our brand compare to competitors’ products in terms of its availability?2. Is the brand increasing or decreasing in availability over time?3. How quickly is a new product becoming available on retailers’ shelves?4. How do distribution levels around the country compare? |
|
|
Breadth of distribution |
How many stores carry the brand? %ACV How widely available is it? Because larger stores serve more consumers, it is generally more important for a brand to bepresent in these larger stores, than in the smaller ones. Being available on the shelves oflarger stores allows to reach a large number of potential consumers. |
|
|
How do we address differences in store sizes when investigating distribution ? |
ACV = All commodity volume -Addresses the issue of bigger stores serving more customers -measures the size of retail store in DOLLAR SALES in all product categories in a year -different that %ACV |
|
|
How do we asses Breadth of distribution? |
%ACV a.k.a Weighted distribution -wayyyyy more accurate that just %stores selling %of stores selling with stores weighted based on their size. %ACV = (total ACV of stores selling our brand/Total market ACV)*100 Note that a product must scan at the cash register in a store for it to count as being indistribution there. If it is on the shelf but does not sell, it will not be counted as being indistribution, because it will not scan at the cash register. |
|
|
Depth of distribution |
breadth of distribution is important to understand:- Whether new items within a product line are being added on the shelves, or are simplybeing swapped in for other items within the product line that were already on the shelves.- Quantify total shelf presence. Ave # of items carried per store = (Sum %ACV of the individual items) /(%ACV of the brand) |
|
|
how do we fairly compare two products with different levels of distribution? |
Sales Velocity aka sales rate or turns. - tells us how fast an item sells where it is indistribution. - can be interpreted as a measure of brand strength, measures control for distribution |
|
|
How do we measure sales velocity |
a.k.a Sales per point of distribution SPPOD = (total sales)/(%ACV) VelocityVelocityMedusaVelocityVelocity Sales per point of distribution should only be used to make comparisons among products soldwithin the same geographical market. This is because a point of distribution might havedifferent value across different geographical markets, depending on the market ACV. |
|
|
Whatsup with Price?? |
Key Driver of both Base and incremental sales No-promo Price =average scanned price of a product in stores where there was no promotionPromo Price = average scanned price of a product in stores where there was a promotion Average Price =price of a product calculated as the weighted average of both non-promo and promo prices |
|
|
mind the PRICE GAP |
Price gap is simply the difference in price between your product and the competition. A pricegap can be calculated in absolute or relative terms (i.e. as a %). Absolute = Prod A price - Competitor Price %price gap = (Prod A price - Competitor Price)/ competitor price |
|
|
Promotion intensity |
We can assess how reliant on merchandising activities a brand is, by calculating an index ofpromotional intensity. This metric indicates what percentage of total sales occurred onpromotion Promo intensity = (total any promo sales)/(Total sales) * 100 is particularly useful to compare PI across brands, geographies and time periods |
|
|
What can we use to quantify the effectiveness of diffent promotion activities at increasing sales |
LIFTTT indicates the % increase in sales due to the presence of whatever merchandising activity %lift = (Incremental Sales)/(Base sales) *100 |
|
|
Promotional effectiveness index |
Measures total sales generated by a promotion relative to sales that would have been expected without it (Bases sales). Is a more fine-tuned lift PEI = (Total promoted / Base sales) * 100 Remember it is an INDEX i.e a pei of 100 means promo sales = base sales and promo sucked |
|
|
Store Data |
AKA POS The defining characteristic of POS data is that it records all transactions that occur in a storeover an certain period of time. This data consist of weekly pricing, volume, and storeenvironment information generated by point-of-sale systems.POS data is perhaps the most commonly used data. It’s collected through POS (point-of-sale)in-store systems. You’ll also hear this type of data referred to as “scanner data”. |
|
|
Shopper Data |
Panel The defining characteristic of panel data is that it links purchases to a specific individual orhousehold over a certain period of time.Panel data is tied to individual buying households. With panel data, you can look at theconsumer dynamics underlying your sales patterns. Panel data can tell you thedemographics of your buyers, how often they buy, how loyal they are, and what otherproducts they purchase. It’s sometimes referred to as “household data”. |
|
|
Both store and shopper data can be acquired from |
specific retailers and syndicated vendors ie. Walmart and Neilsen |
|
|
Shopper analysis tree |
|
|
|
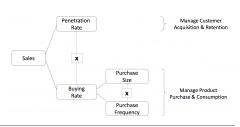
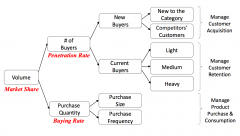
penetration rate |
the % of the total population that purchased the product at least once in a year = number of household buying / # households in the market market could be geographical |
|
|
Buying rate |
purchase frequency X purchase size |
|
|
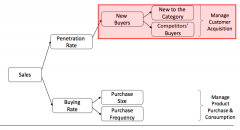
How can panel data help us identify where new buyers are sourced from? |
|
|
|
Share of requirements |
aka share of wallet Share of Requirements (also called Share of Wallet) refers to the percentage of categoryspending (in dollars, units or volume) the average buying household allocates to a specificbrand, in a given time period (usually 1 year).To illustrate, if share of requirement for Brand A is 30%, it means that each householdwho bought Brand A, on average, allocated 30% of their category spending to Brand A. |
|
|
Customer Lifetime value |
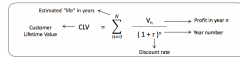
Customer lifetime value refers to the value a customer can produce for a companyover its entire “life” as a customer of the company. |
|
|
Customer acquisition cost (per customer) |
total cost / number of customers acqurired |
|
|
CLV: How do long term customers increase company's profit |
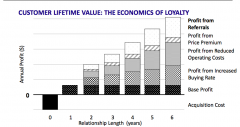
example $shave club |
|
|
Importance of customer retention |
retention rate = pretty important - It costs 5 times more to acquire a new customer than to retain an old one- A 5% increase in retention rate can boost profits by 25-85% |
|
|
Pareto principle |
Pareto Principle (80–20 rule): 80% of your profits come from 20% of your customersAlso true in many other domains:- 80% or your revenues come from 20% of your customers- 80% of your complaints come from 20% of your customers- 80% of your results come from 20% of the time you spend- 80% of your sales come from 20% of your products- 80% of your sales come from 20% of your sales force |
|
|
Business goals (smart) |
Specific measurable achievable relevant Time-bound |
|
|
Short term goals vs LTG |
However, focusing exclusively on hitting the yearly profit goal can induce ashort-term orientation that might lead to decisions that undermine the long-termsustainability of the business. To avoid this problem, it is important to set short-termgoals (e.g. 1-3 year) that are aligned with long-term (i.e. 5-10 year) goals. |
|
|
two ways to acquire customers |
Steal market share grow the category |
|
|
buying rate |
purchase size X purchase frequency |
|
|
Sources of volume tree |
|
|
|
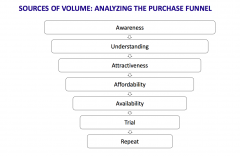
THE PURCHASE FUNNEL |
|
|
|
gaps in the purchase funnel |
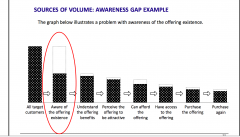
gaps can happen anywhere |
|
|
Drivers of net price |
retail price channel margins |
|
|
Value proposition |
The ultimate goal of Marketing Strategy is to Identify anOptimal Value Proposition.A value proposition is a promise of value to be delivered,and reflects all benefits and costs of the offering to the targetgroup of customers. 3 steps to value proposition -targeting -segmentation -positioning |
|
|
strategy |
Value proposition |
|
|
tactics |
finding profit (4 P's) profit is the middle p in the circle |
|
|
Value proposition -> volvo car |
Consumer cost benefit analysis Costs: Price, fuel efficiency, maintenance Benefits: Performance, comfort, safety, reliability
|
|
|
Functional Value |
The functional value of an offering isinfluenced by attributes that determineits performance, such as functionality,reliability, durability, design, ease of use,form, style, packaging, technology, etc. |
|
|
Psychological Value |
The psychological value of an offering istypically influenced by the emotional needsan offering satisfies, such as safety, status,respect, belonging, esteem, |
|
|
Monetary Value |
Although for a customer monetary value istypically related to costs, an offering can alsobe provide monetary benefits such asbonuses, prizes, discounts, rewards, etc. |
|
|
Segmentation |
Identifying subsets of customers with similar needs, characteristics and behaviors == market segements Meaningful segmentation is done through customer value analysis |
|
|
Why we segment |
-Heterogenius markets; diff customers have diff needs -subsets always exist -facilitates targeting -identifying key traits of groups helps with customized value analysis |
|
|
Steps in segmenting |
1.) value based customer value: needs, wants, benefits sought.. 2.) profile based -demographic -geographic -behavioral -psychological |
|
|
fine tuning segementing |
A meaningful segmentation then links value-base segments to observablecustomer’s characteristics, so that each segment has an identifiable profile Factors include -geographic -demongraphic -psychological -behavioral |
|
|
Characteristics of meaningful segments |
1.) Value-based 2.) mutually exclusive 3.) mutually exhaustive 4.) Substantial = large enough to provide value to company and collaborators 5.) Actionable |
|
|
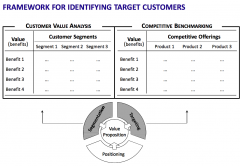
Definition of targeting |
key isdifferentiation: targeting aims to select customersegments for which the company can providebetter value than competitors.Meaningful targeting is therefore achieved throughcompetitive benchmarking make segments -> target YOUR segment |
|
|
why shouldnt we just target any customer |
It is difficult to develop an offering that fits everyone’s needs while creatingvalue for the company.- Developing a unique value proposition requires tradeoffs, it requires nottargeting certain customers and not including certain product features.- Successful targeting leads to a reduction of the degrees of freedom of themarketing mix (consequently, having too many degrees of freedom whendesigning the marketing mix means that the target market is too broad andheterogeneous). |
|
|
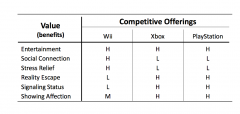
Value benefit matrix // competitive benchmarking |
|
|
|
Framework for identifying target customers |
|
|
|
Definition of positioning |
The ultimate goal of positioning is to identify andcommunicate a clear competitive differentiation.
emphasizeone single benefit from the overall value proposition,and not emphasize other benefits, to better bring thekey differentiating benefit into focus.Positioning is not intrinsic in an offering, it iscreated in the minds of customers |
|
|
difference between value positioning and positioning |
Value Proposition reflects all benefits and costs of the offering to target customers. vs Positioning reflects the primary benefit of the offering to target customers. |
|
|
tricky part about positioning |
Successful positioning requires tradeoffs:not promoting some benefits helps articulate the key benefit |
|
|
2 steps to developing a clear positioning |
1 Establish a frame of reference 2 Identify the key differential benefit |
|
|
Establish a frame of reference during positioning |
Need based vs. Category Based |
|
|
How to establish a key differential benefit |
Attribute value map- - y axis = high/low - x axis = different artistes - series = different competitors Positioning Map -x axis one set of polar attributes - y axis different set of polar attributes - dots = competitors |
|
|
Positioning triangle |
Top corner = frame of reference, lists all benefits in market Right corner = competitive offerings; competitors and their positionings Left corner = company, our primary offering (positioning) and secondary benefits |
|
|
Positioning statement |
Structure: - Target customers -Frame of Reference (customer need or competitive offering) -Key source of value (primary reason for choice) 2Types: Non-comparative vs. Comparative |
|
|
External influences of positioning |
4 external c's |
|
|
Common misconceptions about positioning |
The more-is-better fallacy: promoting more benefits leads to a better positioning=> Positioning requires tradeoffs, not promoting some attributes- The illusion of control: the company controls the way customers perceive its offerings=> Positioning is function of all 5 Cs- The advertising fallacy: advertising is the only positioning tool=> Positioning is communicated by all the elements of the marketing mix |