![]()
![]()
![]()
Use LEFT and RIGHT arrow keys to navigate between flashcards;
Use UP and DOWN arrow keys to flip the card;
H to show hint;
A reads text to speech;
131 Cards in this Set
- Front
- Back
- 3rd side (hint)

Changes in answer probabilities produce different outcomes & when they are set at the least favorable levels a __________ ensues & when set at the most favorable levels a __________ ensues |
Worst-case scenario, best case scenario |
|
|
|
One key observation of product development is the % of revenues obtained from new products were |
a key differentiator of successful/unsuccessful firms |
|
|
|
Another key observation of product development is that |
costs can be enormous with high failure rates (50-96%) |
|
|
|
This failure scenario was why a technology-driven product failed to match consumer needs (28%) |
The Unwanted "Better" Mousetrap |
Technology-driven products that fail to match consumer needs |
|
|
This failure scenario was the replication of a successful product (24%) |
The "Me-Too" Product |
|
|
|
This failure scenario is when the product falls short of performance requirements (15%) |
Technical Dog |
|
|
|
This failure scenario happens when competitors alter the landscape (13%) |
Competitor Reactions |
|
|
|
This failure scenario is when the seller overestimates how much the consumer will pay, maybe due to over-engineering (13%) |
Price |
|
|
|
This last reason covers all the rest of failure scenarios (7%) |
Other |
|
|
|
Good and poor performing firms have an enormous within-industry difference in terms of this |
ROI - sales or profits divided by R&D costs or time |
|
|
|
The factor that shows the largest difference between the most and least productive firms is |
Degree of Customer Focus |
|
|
|
Marketing has the largest effect on market performance compared to R&D or Operations because |
Marketing knowledge is less imitable than tech (patents) or operational prowess (six sigma) |
|
|
|
A "macro" view of why a product can fail is |
To be unique, the new product must fill a niche, but once niches are too niche (small) to become profitable new products must displace the incumbents (which is never easy) |
|
|
|
When the incumbent is the first entrant (pioneer) to the market, they enjoy not only uniqueness but the following five advantages: |
- Brand Loyalty - Distribution Barriers - Economies of Scale - Premier Positioning - Standard Setting |
|
|
|
Recent analyses suggest that the pioneer advantage may be smaller than originally thought and |
Late movers often come to dominate many product categories |
|
|
|
At least one reason for pioneers failing to maintain a long-term advantage is |
Technology Vintage Effects:
the use of more recent tech enables later movers to achieve higher quality & lower costs, negating the pioneer advantage when consumers value quality |
|
|
|
Another reason for pioneers failing to maintain a long-term advantage is |
Protracted Development and Adoption:
When development extends over a long period of time, the advantage of being the originator diminishes and different skills may be needed |
|
|
|
The idiosyncratic factors for pioneers failing to maintain a long-term advantage are |
- envisioning the mass market - managerial persistence - financial commitment - relentless innovation - asset leverage |
"Imitation is more valuable than innovation" |
|
|
The most basic approach of idea generation for product development is |
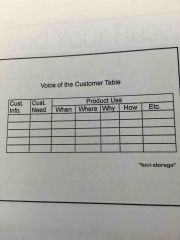
Voice of the Customer Table (VoCT) - interview customers to uncover their desires so the benefits and usage context are clear (see table in hint) |
|
|
|
An approach to idea generation for product development that asks consumers about what blocks their satisfaction with a product is called this |
Problem Detection Analysis: problems are more episodic and specific |
|
|
|
This approach to idea generation for product development asks consumers to be involved in the design process of their ideal product/service |
Consumer Idealized Design |
|
|
|
An approach to idea generation for product development that asks consumers about what blocks their satisfaction with a product is called this |
Problem Detection Analysis:
problems lead to specific feedback about that episode that was bothersome |
|
|
|
This approach to idea generation for product development has the consumer develop the product idea, which the marketer adopts and adapts to. |
Lead-User Analysis |
|
|
|
Someone who faces a product need ahead of others and is positioned to benefit significantly from a solution to the need is called _________ |
A lead user |
|
|
|
New product ideas are based on actual observation of consumer behavior to solve problems they don't even know they have in this approach of new product idea generation |
Emphatic Design (unarticulated needs) |
|
|
|
This method of idea generation for product development combines observation with one-on-one interviews of the customer's activities. |
Contextual Inquiry |
|
|
|
This method of idea generation for product development uses of hierarchical listings of consumer needs to uncover a fresh perspective after seeing unexpected relationships in the data |
Affinity Diagram (sticky notes, grouped by Hierarchy) Hope to uncover unexpected relationships that spark breakthroughs in understanding the data. |
The goal of this is to be as "data-driven" as possible to avoid the contaminating effects of your own preconceptions/biases |
|
|
This method for generating new product ideas was pioneered by marketing-oriented engineers |
Concept Engineering |
|
|
|
With regard to idea generation techniques, it's characterized as a mega-brainstorming exercise |
Crowd-sourcing |
|
|
|
Consumer Analysis |
Goal is to measure the relative importance of a product's features. Because it is not possible to accommodate all desires or meet all needs/benefits. |
|
|
|
CA method. A set of categories designed to elicit information about an attribute. A person selects the number which is considered to reflect the perceived importance of a feature. |
Rating Scales |
|
|
|
Challenges of a rating scale |
Do they want the attribute or a level of the attribute? Which are most important? Can't have a product that is 10/10 in everything (trade offs). |
|
|
|
This Consumer Analysis method requires respondents to make "trade-offs" and divide a set number points among the dimensions (usually 100). |
Constant-Sum Measures |
|
|
|
In this CA method, the designer needs to know how the consumer makes trade-offs to determine the level of each dimension to include into the product design. A different utility is computed for each level of each dimension. |
Conjoint Analysis |
It's impossible to max out on all dimensions due to physical limitations or cost constraints |
|
|
Too often, this is an afterthought in prod Dev yet was the most important determinant (according to Senior mgrs) of new product success. |
Traditional Design Issues |
|
|
|
Traditional design enables a firm to achieve the following 4 marketing objectives/benefits: |
1 - get noticed & create identity (ex: Prius) 2 - communicate information (ex: Dodge Ram looks like a semi) 3 - raise utility (Improvements to design) 4 - create positive affect/aesthetics (buy prettier of two equal products) |
|
|
|
This marketing concept of the design world that places the user at the center of the design process rather than at the end and requires developers know the tasks the consumer wishes to achieve. (Takes time and money) |
User-Centered Design |
- frequently not integrated in the design process - firms are guilty of not applying marketing concept to design process |
|
|
This reason for suboptimal design increases when there's pressure to introduce new products |
Time Pressure |
UCD also takes time and money |
|
|
This reason for suboptimal design has a tendency to add features but not reduce usage complexity accordingly (product ends up too complicated to use) |
Creeping Featurism |
|
|
|
Users are not purchasers |
This is a reason for suboptimal design because purchasers rely on price and other considerations rather than function |
|
|
|
This reason for suboptimal design states if the better design is more costly, it may not be preferable overall |
Everything Requires Tradeoffs |
|
|
|
This reason for suboptimal design is where managers are accused of not being better at their job (more of an issue than a legitimate challenge) |
Insensitivity to Design |
|
|
|
This happens when a designer's proficiency using the product leads to misinterpretations and problems by first time users (blank sheet) |
Lack of empathy |
Complexity causes 50% of product returns |
|
|
Many functions within the firm may be involved in this form of design where the interface between engineering/design and marketing is critical to product management |
Cross-Functional Communication |
|
|
|
What is the virtue (benefit) of communication? |
Firms in which managerial action is taken to promote the sharing of information across disciplines report a much higher degree of new product success than firms who do not |
Tool that covers this is the House of Quality |
|
|
1st step of tHoQ: VoC is defined in consumer terms not in engineering terms or in terms of solutions |
Identify Consumer Needs |
|
|
|
2nd step of tHoQ: VoC defines needs in terms of both consumer desires & terms that can be acted upon by engineers |
Operational needs should be context specific |
|
|
|
3rd step of tHoQ: VoC is to measure this |
The importance of each need |
|
|
|
4th step of tHoQ: VoC is to measure consumer evaluation of the performance of |
Your product and the competitors product on the needs |
|
|
|
Commoditization |
Process whereby buyers of goods and services base purchase decision on price |
|
|
|
Name all Failure Scenarios |
Unwanted better mousetrap Me too product Technical dog Competitor reactions Price Other |
|
|
|
When does failure occur? |
Not defined but if you do beginning steps right you are more likely to carry that success through to market. Earlier stages are cheaper. |
|
|
|
Degree of customer focus |
Top and bottom 25% performing firms (ROI) in an industry. Key difference is degree of customer focus. |
|
|
|
Product failure from a strategic perspective considers these 2 points: |
1 Macro View of Prod Failure 2 Order of Entry and Success (incumbent advantage) |
|
|
|
How do you avoid the commoditization trap? |
Successful innovation |
|
|
|
Protracted Development and Adoption is caused by two factors: |
1 Supply side (tech development) 2 demand side (consumer acceptance) |
|
|
|
What are 3 reasons prisoners do not maintain advantage? |
1 technology vintage effects 2 protracted development and adoption 3 idiosyncratic factors |
|
|
|
Marketing's Role in NPD |
Where marketing is involved in the process is the degree of customer focus. |
|
|
|
Voice of the Customer Table |
Type of idea generation. Interview customer for benefits and needs in context |
|
|
|
Problem Detection Analysis |
Type of Idea Generation. Ask what problems they encounter with a product (ask what they don't want instead of what they want). Problems are episodic and specific, based on last use. |
|
|
|
Consumer Idealized Design |
Type of idea generation. Instead of improving current product, ask consumers to design a solution from scratch. |
|
|
|
9 types of idea generation that involve the customer |
1 voice of the customer table 2 problem detection analysis 3 consumer idealized design 4 lead-user analysis 5 empathetic design 6 contextual inquiry 7 affinity diagrams 8 concept engineering 9 crowd sourcing |
|
|
|
Lead-User Analysis |
Type of idea generation. lead users are users of a product or service that currently face needs that are not yet general in marketplace but will be. User designs solution and benefits from solution. |
|
|
|
Empathic Design |
Type of idea generation. Understands unarticulated user needs by observing consumer behavior. (Like anthropology) |
|
|
|
Contextual Inquiry |
Type of idea generation for product development. Combines field observation and interviewing. |
|
|
|
Affinity Method |
Move sticky notes around on wall -> label term for group of notes -> group groupings until hierarchical structure forms |
|
|
|
Affinity Rationale |
derives general principles from specific observations (inductive) and data-driven |
|
|
|
Concept Engineering |
Type of idea generation for new product. Combines several methods. LL Bean video. |
|
|
|
Counter argument to involving customer in new product idea generation |
Disruptive Technologies = An innovation that creates a new market by applying a different set of values, which ultimately (and unexpectedly) overtakes an existing market. (e.g., the lower priced Ford Model T) |
|
|
|
3 methods of measurement when conducting consumer analysis |
1 Rating Scale 2 Constant-Sum Measures 3 Conjoint Analysis |
|
|
|
3 areas of design issues we discussed: |
1 Traditional design issues 2 design management 3 cross-functional communication |
|
|
|
What issue arises with design management? |
Frequently not fully integrated into the product development process |
|
|
|
What are 6 reasons for suboptimal design? |
1 time pressure 2 creeping featurism 3 users are not purchasers 4 everything requires trade offs 5 insensitivity to design 6 lack of empathy |
|
|
|
What issue gets in the way of cross-functional communication? |
Marketing and engineering are typically at odds instead of working together. |
|
|
|
5th step of tHoQ: VoE is to identify the design attributes for each need |
Possible solutions |
|
|
|
6th step of tHoQ: VoE is to measure your vs competitors performance on attributes |
6th step of tHoQ: VoE is to measure your vs competitors performance on attributes |
|
|
|
7th step of tHoQ: VoE is to determine how each attribute impacts consumer need |
7th step of tHoQ: VoE is to determine how each attribute impacts consumer need |
|
|
|
7th step of tHoQ: VoE is to determine how each attribute impacts consumer need |
7th step of tHoQ: VoE is to determine how each attribute impacts consumer need |
|
|
|
7th step of tHoQ: VoE is to determine the relationships among design attributes |
7th step of tHoQ: VoE is to determine the relationships among design attributes |
|
|
|
Two reasons why forecasting is not as easy as asking consumers how many products they would buy |
1 Attitude-Behavior Inconsistency 2 Attitude-Attitude Inconsistency |
|
|
|
Two reasons why forecasting is not as easy as asking consumers how many products they would buy |
1 Attitude-Behavior Inconsistency 2 Attitude-Attitude Inconsistency |
|
|
|
Attitude-Behavior inconsistency |
When people's attitudes (opinions) do not predict their behavior (actions); ex consumers said they would buy green products but didn't |
|
|
|
Attitude-Attitude Inconsistency |
When the product designer's attitude does not match the consumers'; ex Stravisky's composition |
|
|
|
Attitude-Attitude Inconsistency |
When the product designer's attitude does not match the consumers'; ex Stravisky's composition |
|
|
|
Reasons for forecasting inaccuracies |
1 new technology is inferior to existing one 2 innovation begins primitive, and is not well understood 3 skeptic of new technology due to over exaggerated downside 4 people think of the new technology in terms of what it is replacing 5 biggest market is not apparent 6 lack of insight due to inability to ID consumer needs (technology too new) |
|
|
|
Name 5 approaches to forecasting |
1 Normed Purchase Intent 2 Critical-Issues grid 3 Scenario analysis 4 Diffusion models 5 Qualitative Determinants of Diffusion |
|
|
|
What is Normed purchase intent? |
An approach to forecasting. Market potential is the size of the relevant population (segment it is positioned for) adjusted for purchase intent. Can only be done if norms or TW is known.
Potential = Population x Buyers
Buyers = E (ITBi) (TWi) Intention to buy (ITB) is proportion of sample who said they would and Translation weight (TW) applies to last response category based on historical response rate. TW requires past experience with like product. |
|
|
|
Normed purchase intent is just a first step toward forecasting. What else needs to be considered? |
The firm's actions Sales = Population x Buyers x Awareness x Availability... |
|
|
|
Critical-Issues grid |
Approach to forecasting. The grid consists of 5 "environments" or forces, each of which is considered at 3 levels of abstraction. |
|
|
|
Critical-Issues grid |
Approach to forecasting. The grid consists of 5 "environments" or forces, each of which is considered at 3 levels of abstraction. Poor predictions mean there was a blank in the grid somewhere (insufficient analysis). |
|
|
|
5 environments of the critical issues grid |
1 political 2 behavioral (consumer interaction with product) 3 economic 4 social (way people interact) 5 technological |
|
|
|
3 levels of critical-issues grid |
1 company 2 business ecosystem 3 infrastructure |
|
|
|
Scenario planning |
Approach to forecasting. Critical issues grid is the starting point that constructs multiple possible futures. Scenario planning assigns different probabilities to the scenarios in the grid. Objective is to find the most likely outcome(s). |
|
|
|
Benefit of scenario planning |
Reduces bias by forcing forecaster to consider all possibilities bc naturally lean towards best case |
|
|
|
Pitfall of scenario planning |
Managers unrealistically believe probabilities are accurate and become overconfident. |
|
|
|
Project Premortem |
Assume the project failed, and managers determine what went wrong. Gets rid of the damn the torpedoes attitude of those over-invested |
|
|
|
At the most fundamental level, why do new products fail? |
1 consumers do not want the product 2 they don't want it fast enough |
|
|
|
Diffusion models |
A forecasting approach that takes a dynamic perspective to understand the rate at which a product will penetrate the market. The parameters of the sales formula are given temporal perspective (t) since likelihood of sale varies over time as a function of firm's efforts. Salest = Populationt x Buyerst x Awarenesst x Availabilityt... |
|
|
|
Diffusion models: Buyer Variable |
Social interaction process that exerts more pressure on an individual to adopt as more people adopt |
|
|
|
Diffusion models' treatment of the Buyer Variable |
Buyers = New Adopters formula. Social interaction process that exerts more pressure on an individual to adopt as more people adopt. Innovators and imitators two segments contained in model. Value of model can be high if p and q can be reliably estimated. |
|
|
|
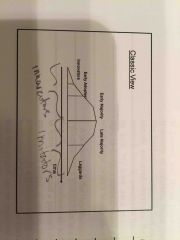
Diffusion model's treatment of classic segment characteristics |
Classic view divides population into 5 segments, and it: 1 believes earlier adopters less risk adverse, need less quality, being first to try is utility, and they influence the remaining consumers 2 uses the normal curve |
|
|
|
High-Tech Discontinuous Diffusion |
A different description of the 5 classic segments in the case of adoption of discontinuous innovation (products that require us to change our current mode of behavior or modify other products). Puts a big chasm and separating gaps in the curve. |
|
|
|
5 classic segments (forecasting product adoption; type of diffusion model) |
Innovators Early adopters Early majority Late majority Laggards |
|
|
|
The Chasm View |
People in a category get the same benefit from product. Segments are not related to each other or continuous because these groups of people are not friends with each other. |
|
|
|
The Chasm View |
Segments are not related to each other or continuous because (reason for chasm): 1 People in a segment get the same benefit from product; different objectives affect how much refinement they need 2 No word of mouth effect; these groups of people are not friends with each other to influence non-group person |
|
|
|
In the chasm view what are the 5 segments and where is the chasm? |
1 Technology enthusiasts 2 visionaries ** chasm 3 pragmatists 4 conservatives 5 skeptics |

|
|
|
Using an analogous product to estimate p and q... |
It can be risky! If you are not confident in it, examine the qualitative determinants of innovation diffusion. |
|
|
|
What are qualitative determinants of innovative diffusion? (Definition) |
There are a core set of factors (representing demand-side influences) that determine likelihood and speed of diffusion (in addition to the firm's actions of course). |
|
|
|
List the 7 qualitative determinants of diffusion: |
1 relative advantage 2 risk of adoption 3 perceived complexity 4 compatibility 5 ease of observing the benefits 6 likelihood of communicating the benefits 7 divisibility |
|
|
|
List the 7 qualitative determinants of diffusion: |
1 relative advantage 2 risk of adoption 3 perceived complexity 4 compatibility 5 ease of observing the benefits 6 likelihood of communicating the benefits 7 divisibility |
|
|
|
How is "relative advantage" a determinant of diffusion? |
Compare - higher utility, lower cost, social status, etc. |
|
|
|
How is "relative advantage" a determinant of diffusion? |
Degree to which new product has perceived advantages over competing brand. Compare - higher utility, lower cost, social status, etc. |
|
|
|
How is "risk of adoption" a determinant of diffusion? |
People evaluate whether adopting is worth the risk. Could be a health, monetary, social, or other risk. |
|
|
|
How is "risk of adoption" a determinant of diffusion? |
People evaluate whether adopting is worth the risk. Could be a health, monetary, social, or other risk. |
|
|
|
How is "perceived complexity" a determinant of diffusion? |
Complex to use, understand, etc. |
|
|
|
How is "risk of adoption" a determinant of diffusion? |
People evaluate whether adopting is worth the risk. Could be a health, monetary, social, or other risk. |
|
|
|
How is "perceived complexity" a determinant of diffusion? |
Complex to use, understand, etc. |
|
|
|
How is "compatability" a determinant of diffusion? |
If a new product is not compatible with an old product or older way of doing things, it presents a switching cost to the potential adopter. |
|
|
|
Product-User incompatibility |
May range from the minor (touch/feel of new product) to the major (learning a new routine) |
|
|
|
Product-product incompatibility |
New product does not fit with other components with which it is normally used. |
|
|
|
How is "ease of observing the benefits" a determinant of diffusion? |
How obvious the benefit is or how quickly the benefit is apparent |
|
|
|
How is "ease of observing the benefits" a determinant of diffusion? |
How obvious the benefit is or how quickly the benefit is apparent |
|
|
|
How is "likelihood of communicating the benefits" a determinant of diffusion? |
Word of mouth |
|
|
|
How is "ease of observing the benefits" a determinant of diffusion? |
How obvious the benefit is or how quickly the benefit is apparent |
|
|
|
How is "likelihood of communicating the benefits" a determinant of diffusion? |
Word of mouth |
|
|
|
How is "divisibility" a determinant of diffusion? |
Ease of trial; whether you can sample it |
|
|
|
What is the long nose of innovation? |
The bulk of innovation is low-amplitude and takes place over a long period. Companies should focus on refining existing technologies as much as creating new. |
|
|
|
Is imitation more valuable than innovation? |
Imitation is an intelligent search for cause and effect. Nearly 98% of the product's benefit is captured by the imitator. |
|