Reading...
![]()
Play button
![]()
Play button
![]()
Use LEFT and RIGHT arrow keys to navigate between flashcards;
Use UP and DOWN arrow keys to flip the card;
H to show hint;
A reads text to speech;
27 Cards in this Set
- Front
- Back
|
What is conjoint analysis used for?
|
Measuring preferences by utility functions. Using conjoint analysis, we can study how the utility of a product varies based on the change of its attributes.
|
|
|
The attributes in the multi-attribute utlity model can be _____ or _____.
In order to keep the overall utility level, sometimes the the low presence of an attribute is ___________. |
perceptual or physical
compensated by another attribute with a higher presence |
|
|
An attribute can be considered very important by a buyer but not perceived as present in a particular brand. The problem is whether to _______________ or ________________________.
|
reinforce the presence of the attribute in the product
convince people that the attribute is actually present |
|
|
Describe how a company can determine whether they need to reinforce an attribute or convince people that the attribute is present
|
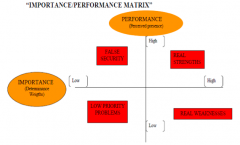
• If in real strength the attribute should be highlighted in communication
• If in weakness the firm needs to reinforce the presence of the attribute in the product • If in low priority problem reallocate resources • If in False security no additional action is required |
|
|
What is a consideration set?
|
Not all attributes of the product can be tested/evaluated, so researchers narrow the attributes which they will test, based on cut-off rules. This is called a consideration set.
|
|
|
How does a market researcher determine how to define the consideration set?
|
Either through a conjunctive or disjunctive model.
• Conjunctive models: the standard must be met for all key attributes • Disjunctive models: the standard must be met for at least one key attribute |
|
|
What is conjoint analysis?
|
Any decompositional method that estimates the parameters of consumers utility functions given their overall evaluations for a set of multiple alternatives.
|
|
|
With conjoint analysis, the customer is presented with a set of several multi-attribute product profiles, and required to ________1________. Each product evaluated by the respondent constitutes an _____2____. So if a respondent rated 5 products, he/she generates 5 input records.
|
1. evaluate them accordingly to his affective attitude
2. input record |
|
|
1. how are importance weights of responses estimated?
2. How are preference emotions usually measured? |
1. with regression based models
2. Ratings (describing the intensity of preference), Choices (preferred product in a given set), and Orders (product ranking, pairs comparisons) |
|
|
Describe the steps involved in the conjoint study
|
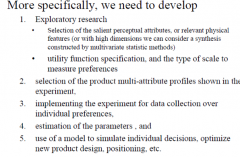
see above
|
|
|
What does conjoint analysis show us?
(4 things) |
(1) An examination of tradeoffs people make
(2) A determination of interactions (3) Predict market shares (4) It is also used to determine price and tradeoffs between price and product qualities (because we can infer an evaluation-ranking of all product parts so we can also calculate the expected utility of a new product that is a combination of several parts) |
|
|
SEGMENTATION
What is it? |
It is the process to group customers according to common characteristics. Usually it is done using available info on them.
|
|
|
What are the basic preference patterns you should know to segment?
|
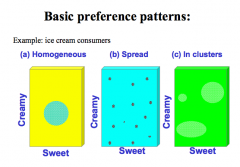
see above
|
|
|
What are the main steps to segmentation?
|
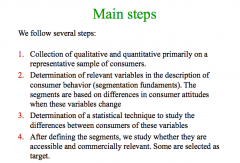
see above
|
|
|
What are the requirements for a successful segmentation (e.g. viability, interesting to the company)
|
MAPD or DAMP
Measurable, Accessible, Profitable (big enough to be worthy), Differentiable (differences between segments are large, but within segments are small) (MAPD) |
|
|
What are the main bases for segmentation?
|
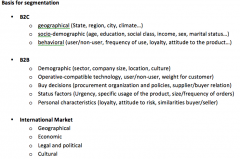
see above
|
|
|
What are the technical tools to find heterogeneity in key variables (segmentation)?
|
1. REgression
2. Cluster Analysis 3. Clustering Algorithms |
|
|
Describe the technical tools regression and cluster analysis to find heterogeneity in key variables
|
• Regression: studies if the changes in some segmentation variables cause a structural change in the individual demand. It is done using regression or ANOVA models.
• Cluster analysis: the typical segmentation, it is a technique that assigns objects to groups so that intra/group similarity and inter/group dissimilarity is maximized. Clustering has no dependent variables and is also called unsupervised learning. |
|
|
Describe the technical tool clustering algorithms to find heterogeneity in key variables
|
o Hierarchical= either starts with single & individual cluster, merging clusters in successive stages (agglomerative), or starting with a single cluster and split in the opposite direction. The visual tree of the clustering is called dendogram
o Non hierarchical= start from a random division of elements into a a predefined number of clusters and re/assign element to clusters in successive stages until a certain criterion is optimized. The most common algorithm is the k/means |
|
|
What are the issues with clustering and what are the solutions?
|
Issue with clustering= an element might be assigned to more than one segment. Solutions
• Latent class techniques= the element is assigned to only one segment • Fuzzy clustering= the element belongs to several segment with a degree of membership *ex> 30% to one, 70% to the other( |
|
|
Once we have defined the clusters, we need to define a way to assign a new element to one of them. There are 2 techniques that in the end are equivalent. What are they? Describe each.
|
• Discriminant analysis= we define a density function based on the variables we have. Then we assign one “density value” to the center of each cluster. Then we calculate the density value of the element to classify and we assign it to the cluster which has the most similar density value. This technique is used to classify heavy, medium, light users of a product in terms of their consumption habits.
• Logistic regression= We use a predictive classification method instead of the discriminant descriptive method but we get to the same result (it is a useless detail, I just mentioned it bcs I am a nerd). |
|
|
PERCEPTUAL MAPS
What is a perceptual map? |
A figure showing the coordinates of the products / brands for two of three dimensions
|
|
|
What are the different techniques for performing multivariate statistical analysis?
|
1. principal components
2. Factorial analysis 3. mutli-dimensional scaling |
|
|
What are principal components? Visualize.
|
o Linear combination of original variables
• Usually, each PC gives a significant weight to few of the original variables. • This fact is used to interpret the principal component – Example: we have 6 variables, and we obtain two principal components with high weigh in their definition are used to name the components. |
|
|
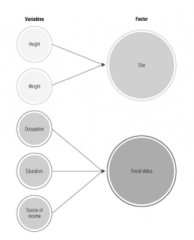
What is factor analysis? What is the objective?
|
Factor analysis is another technique to reduce dimension of the observed variables. It is very popular in marketing and in social sciences in general.
The objective is identical to that of principal components, but it is more difficult to interpret, and require stronger assumptions. It explains the inter-relationships among a large number of variables in terms of their common underlying factors. |
|
|
What does rotation allow?
|
Different solutions can be obtained rotating the estimated factors.
Often different rotations are considered to improve the interpretability of the results There is orthogonal (factors are non-correlated) and oblique (factors are correlated) rotations |
|
|
What are the steps in conducting a factor analysis?
|
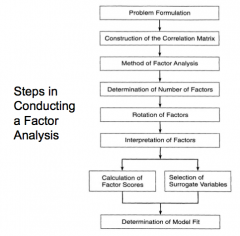
see above
|