![]()
![]()
![]()
Use LEFT and RIGHT arrow keys to navigate between flashcards;
Use UP and DOWN arrow keys to flip the card;
H to show hint;
A reads text to speech;
19 Cards in this Set
- Front
- Back
|
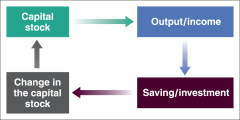
At the centre of the determination of outputin the long run are two relations between output and capital: |
•The amount of capital determines theamount of output being produced •The amount of output determines theamount of saving and, in turn, the amount of capital accumulated over time. |
|
|
Interactions between Output andCapital |
|
|
|
Capital and output dynamics ( Graph ) |
|
|
|
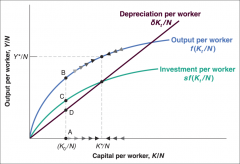
Capital and output dynamics |
Whencapital and output are low, investment exceeds depreciation and capitalincreases. When capital and output are high, investment is less thandepreciation and capital decreases. |
|
|
Three observations about theeffects of the saving rate on the growth rate of output per worker are: |
1. The savings rate has no effect on the long run growth rate of output per worker, which is equal to zero. 2. The savings rate determines the level of output per worker in the long run. All things being equal, countries with a higher saving rate will achieve higher output per worker in the long-run 3. An increase in the saving rate will lead to higher growth of output per worker for some time, but not forever. The period of growth ends when economy reaches the new steady state |
|
|
The effects of different savings rates |
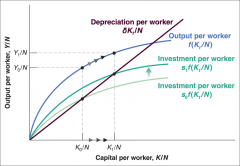
Increases level of steady-state output per worker. |
|
|
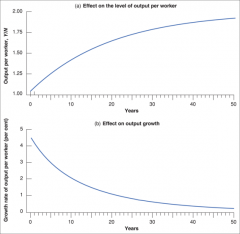
The effects of an increase in the savingrate on output per worker (without new tech) |
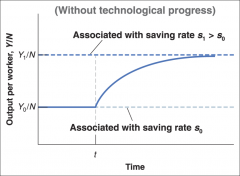
Anincrease in the saving rate leads to a period of higher growth until outputreaches its new, higher steady-state level. |
|
|
The effects of an increase in the saving rate on output per worker (with new tech) |
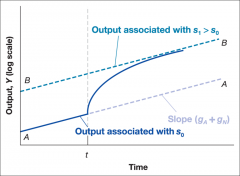
Theincrease in the saving rate leads to higher growth until the economy reachesits new, higher, balanced growth path. |
|
|
Extreme Value of savings rates 1 or 0 |
both lead to zero consumption and the economy cannot function with either levels of saving. |
|
|
The Golden-rule level of capital |
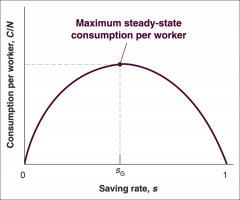
The level of capital associated with the value of the saving rate that yields the highest level of consumption. |
|
|
Effects of social security of levels of capital |
Social security accounts for 44% of EU gov spending, and it has resulted in individuals saving less, which reduces money available for capital investment. Thus lowering the levels of capital and lowering the output per-person in the long run. |
|
|
Two types of pensions at their effects on the stock of capital |
Pay as you go - social security does not save on workers behalf, total saving goes down and so does capital accumulation e.g. france & italy fully funded - workers save less but social security saves for them by investing their contributions in financial assets. e.g. UK & Denmark |
|
|
Cobb douglas production function |
Y = Root K x Root N |
|
|
Theeffects of the saving rate on steady-state output |
Steady-state output per worker isequal to the ratio of the saving rate to the depreciation rate. A higher saving rate and a lowerdepreciation rate both lead to higher steady-state capital per worker andhigher steady-state output per worker. |
|
|
Thedynamic effects of an increase in the saving rate |
|
|
|
Theset of skills of the workers in the economy is called |
Human capital |
|
|
Humancapital, physical capital and output |
Inthe long run, output per worker depends not only on how much society saves butalso on how much it spends on education. |
|
|
In the United States, spending oneducation comprises about 6.5% of GDP, compared to 16% investment in physicalcapital. This comparison: |
•Accountsfor the fact that education is partly consumption. •Doesnot account for the opportunity cost of education. •Doesnot account for the opportunity cost of on-the-job-training. •Considersgross, not net investment. Depreciation of human capital is slower than that ofphysical capital. |
|
|
Modelsthat generate steady growth even without technological progress are called.. |
modelsof endogenous growth. where growth depends on variables such asthe saving rate and the rate of spending on education. |