![]()
![]()
![]()
Use LEFT and RIGHT arrow keys to navigate between flashcards;
Use UP and DOWN arrow keys to flip the card;
H to show hint;
A reads text to speech;
73 Cards in this Set
- Front
- Back
|
GDP (Aggregate Expenditure) Identity |
Y(GDP) = C + I + G + NX Y = Income C = Consumption I = Investment G = Government Expenditure NX = Net Exports |
|
|
Consumption |
Consists of: Services |
|
|
Current Disposable Income |
Total current income (GDP) after taxes are taken out and transfer payments are added. Disposable income expressed as Yd. (Consumption depends on Disposable Income) Yd = Y - T + TR TR = Transfer Payments T = Total Taxes |
|
|
Marginal Propensity To Consume (MPC) |
MPC= ΔC/ΔYd The amount by which consumption spending changes when disposable income changes. Relationship: Yd↑ -> C↑ Yd↓ -> C↓ |
|
|
Marginal Propensity To Save (MPS) |
MPS = 1 - MPC The amount by which saving occurs when disposable income changes |
|
|
Determinants of Consumption |
Current Disposable Income Expected Future Disposable Income Real Interest Rate House Hold Wealth |
|
|
Real Interest Rate |
The cost of borrowing money expressed in percentage form (real interest rate is adjusted to inflation) Real Interest Rate= nominal interest rate - inflation r = i - ∏ r↑ -> C↓ (it cost more to borrow to finance consumption hence there is more incentive to save) r↓ -> C↑ (it cost less to borrow to finance consumption hence there is less incentive to save) |
|
|
Household wealth |
Household Wealth = Household Assets - Household Liabilities Household Wealth = Value of home, car, financial investments (savings, stocks and bonds) Household Liabilities = Credit card debt, balance due on mortgage, balance dude on auto loan Wealth↑ -> C↑ Wealth↓ -> C↓ |
|
|
Price Level |
Price level decrease: Wealth↑ -> C↑ Price level increase: Wealth↓ -> C↓ |
|
|
Investment |
Plant and Equipment: Housing Change in inventories - Finished goods not yet sold - Raw materials not yet used - Unfinished goods still in the production process |
|
|
Determinants of Investment |
Expectations of future profitability - Optimism or pessimism Taxes - Corporate income tax - Investment tax incentives Cashflow Real interest rate r↑ -> I↓ As r goes up it is more expensive for firms to borrow or to buy equipment and build factories. It is also more expensive for families and consumers to buy houses r↓ -> I↑ |
|
|
Net Exports of Goods and Services |
Exports - Imports = NX |
|
|
Exchange Rates |
Nominal Exchange Rate: Price of one currency in terms of another currency. Measured by number of units of foreign currency per unit of domestic currency Real Exchange Rate: The price of goods in one country in terms of the price of goods in another country |
|
|
Calculating Real Interest Rate |
e = (Pdomestic * E)/Pforeign Where E= nominal exchange rate Example Price of watch in Switzerland =SF300 Price of watch in USA = $100 Exchange Rate = SF3 = $1 e= 100 * 3 / 300 e= 1 Hence 1 Swiss watch will buy 1 American watch Another example Price of watch in Switzerland =SF300 Price of watch in USA = $100 Exchange Rate = SF1.5 = $1 e= 100 * 1.5 / 300 e= 1/2 Hence one American watch will only buy 1/2 of a Swiss watch |
|
|
Purchasing Power Parity |
A theory which states that exchange rate between currencies are in equilibrium when their purchasing power is the same in each of the two countries. Ideally real interest rate is at equilibrium when: e = 1 if e > 1 the domestic currency is being over valued if e < 1 the domestic currency is being undervalued |
|
|
Limitations of PPP |
Two Main Reasons: - Many goods cannot be easily traded Price differences cannot be arbitraged away - Foreign, domestic goods not perfectly substitutable Price differences reflect different taste |
|
|
Net Exports |
NX measures the imbalance in a countries trade in goods and services. Net Exports = Exports - Imports NX= X-IM Trade Deficit: An excess of imports over exports Trade Surplus:an excess of exports over imports Balanced Trade: When exports=imports |
|
|
Determinants of Export |
Exports depend on - Real Exchange rate As real exchange rate increases, exports decreases. It is more expensive to buy exports when real interest rate is higher - GDP of trading partners (Y foreign) Higher foreign GDP means that foreign countries are more able to buy exports - Tastes and preferences of people abroad for domestic goods and services Self explanatory - Trade Policies |
|
|
Determinants of Imports |
Import depend on:
- Real exchange rate Increase in real exchange rate = Increase in imports - Domestic GDP (Y Domestic) Increase in domestic GDP = Increase in Imports - Domestic Tastes and Preferences for foreign goods - Trade Policies |
|
|
Net Export determinants |
Real Exchange Rate increase -> Imports increase, NX decrease
Real Exchange Rate decrease -> Exports increase, NX increase Y Domestic increase -> Imports increase, NX decrease Y Foreign increase -> Exports increase, NX increase |
|
|
Increase in USD scenario |
Take the use exchange rate:r us -> Demand for USD denominated assets increases Demand for USD increase E (nominal exchange rate) increase e (real exchange rate) increase Export increase, import decrease Net Exports decrease |
|
|
Balance of Payments |
The record of a country's trade with other countries in goods, services and assets.
Current Account Financial Account |
|
|
Current Account |
Trade in goods and services X - IM Net Exports (NX) |
|
|
Financial Account |
Trade in assets = Foreign acquisition of domestic assets - Domestic acquisition of foreign assets Net Capital Flows |
|
|
Relationship between Current and Financial account |
Current Account = - Financial Account Current Account - Financial Account = 0 |
|
|
Net Foreign Investment (NFI) |
Domestic residents' purchase of foreign assets minus foreigners' purchases of domestic assets NFI = Foreign direct investment + Foreign portfolio investment Foreign direct investment: Domestic residents actively manage the foreign investment eg. McDonalds open a fast food outlet in Moscow Foreign Portfolio investment: Domestic residents purchase foreign stocks or bonds supplying "loanable funds" to foreign firms. When Net Foreign Investment > 0, Domestic Purchases of foreign assets exceed foreign purchases of Domestic assets When Net Foreign Investment < 0, Foreign purchases of domestic assets exceed domestic purchases of foreign assets. |
|
|
The NX and NFI Equality |
Net foreign investment = Net Exports |
|
|
Explanation of the Equality |
When Foreigners purchase a good from the U.S: U.S. Exports and NX increase The foreigner pays with currency and assets, so the U.S. acquires some foreign assets causing NFI to rise When U.S citizen buys foreign goods: US imports rise and NX falls The U.S. buyer pays with US dollars or assets so the country acquires US assets causing US NFI to fall |
|
|
Variables that Influence NFI |
- Real Interest Rates paid on foreign assets - Real Interest Rates paid on domestic assets - Perceived risks of of holding foreign assets - Government Policies affecting foreign ownership of domestic assets |
|
|
The Macroeconomics of Saving and Investment |
GDP (Y) = Cons + Inv + Gov + NX Y - C - G = I + NX Saving = Income - Expenditures For households and firms (Private savings): Income = Y + TR (Transfer Payments) Expenditures = C + T (Consumption + Taxes) Saving Private (SP) = Y+TR - (C+T) For Government (Public Savings): Expenditure = G + TR Saving Public (SPb) = T - G - TR National Saving = SP + SPb S= (Y+TR-C-T) + (T-G-TR) S= Y - C - G HENCE S = I + NX |
|
|
Loanable Funds Market |
The Loanable Funds Market is a function of Supply and Demand where: Supply (Private Saving + Public Saving) Demand (I +NFI) Hence S = I + NFI Rearranging we get S-I= NFI When S> I, the excess loanable funds flow abroad in the form of positive net foreign investment When S |
|
|
Aggregate Expenditure |
Components of Aggregate Expenditure Aggregate Demand vs. Aggregate Expenditure Reasons why AD slopes down: - Wealth Effect - Interest Rate Effect - International Trade Effect |
|
|
Aggregate Expenditure |
Y = C + I + G + NX |
|
|
Aggregate Demand (AD) |
Aggregate demand shows the relationship shows the relationship between aggregate expenditure (Y) and the price level of aggregate expenditure (P) |
|
|
Explaining the relationship of P and Y |
Wealth Effect: Interest Rates: Interest rates bring P up hence Y falls Interest rates more incentive to save and the cost more to borrow Interest rates also cause firms and other producers to invest and borrow money International Trade Effect If price of USD increase, Imports will increase NX will subsequently decrease.
|
|
|
Shifting the AD Curve Forward |
Interest Rates Decrease -> Consumption increase, Investment increase, net exports increase -> AD increase
Income Increase -> C Increase I Increase -> AD increase NX Increase -> AD Increase |
|
|
Shifting the AD Curve Backward |
Interest Rates Increase -> Consumption decrease, Investment decrease, NX decrease -> AD decrease Government Expenditure decrease -> Taxes increase -> AD decreases Income decrease -> C decreases, I decreases -> AD decreases NX decreases -> AD decreases |
|
|
Long Run Aggregate Supply |
Economic capacity to produce in the long
Capital Stock - Factories - Office Buildings - Machinery and equipment Labor - Number of Workers Technology |
|
|
Short Aggregate Supply |
The SRAS curve slope up because contracts wages and prices are sticky (prices are not adjustable in the short run) Menu costs make some prices sticky. |
|
|
What causes SRAS to shift |
Increase in the labor force and capital stock Technological change Expected changes in future prices Adjustment of works and firms to errors in past expectations about the price level Unexpected changes in the price of an natural resources |
|
|
Government Policies that Shift the AD curve |
Monetary Policies - Policies which affect r Fiscal Policy- Policies which affect G and/ or T |
|
|
Government Policies |
Monetary Policy-- Policies which affect r done by the Federal Reserve r increase -> C decrease, I decrease, NX decrease -> AD shifts left r decrease -> C increase, I increase, NX increase -> AD shifts right |
|
|
Government Policies |
Fiscal Policy -- policies which affect G and/or T done by Congress, the White House or the Treasury Dept Y= C+I+G+NX Taxes increase --> Consumption decreases, Investment decrease --> AD shifts to the left Taxes decrease --> Consumption increases, Investment increase --> AD shifts Right |
|
|
Other Factors Shift the AD curve |
Changes in Expectation of Households or Firms
|
|
|
Recessionary Gap and Inflationary Gap |
Recessionary Gap - Y Actual < Y Potential Price Level Goes Down Unemployment > Natural Rate Inflationary Gap - Y Actual > Y Potential Price Level Goes Up Unemployment < Natural Rate |
|
|
Phillips Curve |
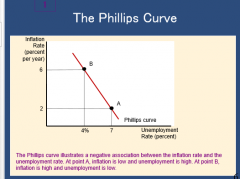
Since Fiscal and Monetary policy affect aggregate demand, the Phillips curves offer the policymakers a set of decisions: Low inflation with high unemployment The Phillips curve illustrates a negative association between the inflation rate and the unemplyment rate. At point A, inflation is low and unemployment is high. At point B inflation is high and unemployment is low |
|
|
The Vertical Long-Run Phillips Curve |
Natural-Rate Hypothesis: The claim that unemployment eventually returns to its normal or "natural" rate, regardless of the inflation rate |
|
|
Money |
Functions of Money - Medium of Exchange - Store of Value - Unit of Account |
|
|
Measures of Money (M1) |
M1 Currency and Traveler's Checks - Cash in the hands of the public Checking Deposits - Held at commercial banks, S&Ls, Saving Banks and Credit Unions |
|
|
Measures of Money (M2) |
- M1 - Savings Deposits - Time Deposits - Money market mutual funds and other deposits |
|
|
What is not Money |
Checks -Checks are not money but checking deposits are Credit Cards - Credit cards merely allow you to take a short-term unsecured loan |
|
|
Depository Instituitons |
- Essential Activity: Take deposits and make loans - Commercial Banks - Thrift Institutions Savings and Loan Associations (S&Ls) Savings Banks Credit Unions - Money Market Mutual Funds |
|
|
Bank Balance Sheet |

|
|
|
The Balance Sheet Equality |
Bank Capital = Assets - Liabilities Aseets = Liabilities+Bank Capital |
|
|
Assets |
Reserves - Vault Cash - Deposits with the Fed Loans Bonds Other Assets |
|
|
Liabilities |
Deposits - Savings Deposits - Checking Deposits |
|
|
Money Multiplier |
Process Starts with a certain value of money that is deposited then loaned, then deposited then loaned.... etc |
|
|
Total Change in Deposition |
Change in Total Deposit = Initial Deposit * 1/R Where R= the reserve requirement Reserve requirement is the required percentage that the banks hold of the initial deposit. E= the amount of their deposit banks are holding as excess reserves Delta Total Deposits = Initial deposit * 1/R+E |
|
|
Change Money Supply |
Change in Total Deposits + Change in Cash Held by the public |
|
|
Reverse Money Multiplier |
What if someone withdraws rather than deposits:
|
|
|
Federal Reserve: What do they do? |
Clear Checks Issue New currency and remove damaged currency Evaluate bank mergers and expansions Lender to member banks Liaison between local community and the Federal System Perform Bank Examinations |
|
|
Federal Monetary Policy Tools |
- Set the Reserve Requirment (R) Currently R = 10 % - Set the discount rate The rate that banks have to pay if they borrow from the Feds - Conduct open Market Operations |
|
|
Monetary Policy |
Expansionary Monetary Policy - Actions which increase the money supply Contractionary Monetary Policy - Actions which decrease the money supply |
|
|
Tools of the Fed |
Open Market Operations The Fed buys and sells bonds |
|
|
An Open Market Operation |
The Fed sells a $1000 Bond to a bond dealer, and the bond dealer pays for the bond by an electronic transfer of $1000 from their checking account
Selling Bond is contractionary monetary policy Buyings bonds is an expansionary monetary policy |
|
|
The Reserve Requirement |
Lowering the reserve requirement will increase the money supply and the multiplier effect |
|
|
Consequences of Feds Buying Bonds |
Fed buy bonds => i decreases Consumption increase Investment increases Net Exports increase AD increases National income increase Unemployment decreases Inflation increase |
|
|
Consequences of Feds Selling Bonds |
Fed sells Bonds => i increases Consumption decreases Investment decreases Net Exports decrease AD increase National income decrease Unemployment increase Inflation decrease |
|
|
The Vertical Long-Run Phillips Curve |
In the long run faster money growth will only cause faster inflation |
|
|
Quantity Equation |
The amount of money in an economy determines the price level of an economy. Changes in money supply results in proportional changes of money supply % money supply results in same % change in price level (inflation/deflation) Quantity Equation = M * V = P * Y M= Money Supply V= Velocity of money (how many times currency is exchanged for goods and services) P= Price Level Y= Nominal GDP Can be written in Growth Rate Form %DeltaM + %DeltaV= %DeltaP + %DeltaY Two Assumptions that hold the Quantity theory to be true In the long run %DeltaV = 0 In the long run %Delta M does not affect %DeltaY Hence %DeltaM = %DeltaP Price level and money supply are directly related pi (inflation (%deltaP)) = %DeltaM - %DeltaY |
|
|
Hyperinflation |
Hyperinflation is generally defined as inflation exceeding 50% per month Price level - Increase more than a hundredfold over the course of a year
Clear link between quantity of money and price level |
|
|
Fiscal Policy |
Government Purchases (G) Taxes (T) Transfer Payments (TR) Expansionary Fiscal Policy G increase TR increase Tax decrease Contractionary Fiscal Policy G decrease TR Decrease Tax Decrease Budget Balance= T-G-TR = T- (G+TR) T> (G+TR) -> Budget Surplus T= (G+TR) -> Budget Balance T< (G+TR) -> Budget Defecit Tax Revenue = T Govt Purchases = G Transfer Payments = TR Federal Debt = Total Accumulated Defecit Budget Defecit = Annual deficit |
|
|
Monetary vs. Fiscal Policy |
Done Only by the FED OMO to affect Ms and i Done by the Treasury Dept Changes in G, T or TR. |