Reading...
![]()
Play button
![]()
Play button
![]()
Use LEFT and RIGHT arrow keys to navigate between flashcards;
Use UP and DOWN arrow keys to flip the card;
H to show hint;
A reads text to speech;
66 Cards in this Set
- Front
- Back
|
Why do we analyse patterns?
|
Analysing patterns in charts is essential to assist in recognising risk and the likely future movement of the market.
|
|
|
The patterns which we see in the market are dictated by...
|
...human emotion - the market constantly moves from equilibrium to disequilbrium as we try to agree on a price for a stock.
|
|
|
The phases of the market help you to...
|
...recognise where the market is at any one point in time.
|
|
|
The various types of bar and candlestick patterns provide...
|
....early warning of a change in trend, enabling you to fine tune your entry and exit.
|
|
|
Name the 4 distinct phases of the market:
|
1. Accumulation
2. Distribution 3. Expansion 4. Contraction |
|
|
What is accumulation?
|
Accumulation takes place at market bottoms and during uptrends.
When market bottoms occur, the stock stops falling in price and we begin to see a sideways move in the market. This sideways move is the accumulation of the stock by institutions wanting to invest for the long term. The accumulate the stock by waiting for sell orders to enter the market. |
|
|
How can we recognise accumulation?
|
Institutions will not tell us when they are accumulating a stock, therefore we need to use technical analysis to recognise when accumulation is taking place and by the stock once the uptrend is confirmed.
|
|
|
How does accumulation occur during an uptrend?
|
During an uptrend, people are buying the stock in increasing numbers. An accumulation pattern will occur during an uptrend when institutions want to slow the trend down to keep their average buy price down. They will stop buying. This is why you see continuation patterns form on low volume.
|
|
|
In a long term bull market, how many accumulation phases are likely?
|
2 or 3 however can be more on the odd occasion.
|
|
|
How long does an accumulation pattern during an uptrend usually last?
|
An accumulation phase in an uptrend generally lasts no more than 3 months, but can be longer, with the stock usually trending quite strongly up out of this phase.
|
|
|
When does distribution occur?
|
Distribution patterns take place a market tops and during a downtrend.
|
|
|
What is distribution?
|
When market tops occur, institutions are selling off their holdings. Therefore the stop stops rising in price and we begin to see a sideways movement in the market. This move is the distribution of the stock by large investors who have held it for the long term. They wait for buy orders to enter the market.
|
|
|
Why do institutions sell their holdings?
|
Institutions need to constantly buy and sell to make profits for their investors and must sell shares when the stock is considered overvalued as this is high risk.
|
|
|
How can we tell when distribution is occurring?
|
Institutions will not tell us they are distributing a stock, therefore we need to use technical analyse to recognise distribution and sell before the inevitable downtrend.
|
|
|
How does distribution occur during a downtrend?
|
Institutions want to slow the increased selling to keep the average price up so they stop selling the stock. This is why continuation patterns form on low volume.
|
|
|
How long does a distribution phase take during a downtrend?
|
Rarely longer than 3 months with the stock trending strongly down out of this phase.
|
|
|
How many distribution phases are there in a long term bear market?
|
Usually there are 2 or 3 but sometimes more.
|
|
|
What is a continuation pattern?
|
A pattern that forms during a trend - the trend of the market before and after the pattern has formed is in the same direction.
Consequently a continuation pattern has the effect of slowing the trend before it continues. |
|
|
Do continuation patterns occur at market tops and bottoms? If not, why not?
|
Continuation patters are the accumulation and distribution of a stock which occurs during an expansion (uptrend) or contraction (downtrend) phase, therefore these patterns will not occur at the top or bottom of a stock.
|
|
|
How does a continuation pattern form?
|
A trend must exist before the pattern forms and there will most likely be rising volume into the pattern. Volume will decrease during the formation of the pattern and increase on the break from the pattern as the stock resumes its initial trend.
|
|
|
What is a reversal pattern?
|
A reversal pattern is where the trend that forms after the completion of the pattern is in the opposite direction to the preceding trend.
Consequently the trend is halted and reversed by the pattern. These patterns occur at the top and bottom of trends. |
|
|
How does a reversal pattern form?
|
A trend must exist before the pattern and there will be rising volume into the pattern. Volume will decrease during the formation of the pattern and increase on the breakout from the pattern as the stock commences a trend in the opposite direction to the preceding trend.
|
|
|
Over what time frame do continuation and reversal patterns form?
|
Continuation and reversal patterns can form over a period of weeks, months or even years.
In continuation and reversal patterns we can often see the formation of reversal signals and candlestick patterns. |
|
|
Reversal patterns can form at a a variety of points on a chart - what does this tell us?
|
Where they form will indicate the likely strength and direction of the move out of the pattern.
|
|
|
What do reversal patterns normally indicate?
|
That a change in the longer term move is likely to occur. Therefore they usually occur over a long period and occupy a significant price range.
|
|
|
What about reversal patterns over short periods?
|
Reversal patterns can form over short periods, a minimum of 5 bars.
|
|
|
What does the time it takes for the reversal pattern to form tell us?
|
The strength of the pattern in turning the market.
|
|
|
How is a head and shoulders pattern formed?
|
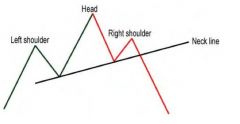
In a rising market, the pattern is formed by an uptrend moving to a peak (left shoulder), usually on rising volume. The stock then corrects into a trough on contracted volume as price falls before return to an uptrend to form another peak (the head), with volume expanding into the formation at the peak. The stock then corrects itself again to form another trough on contracted volume before making one more rally by returning to an uptrend to form the right shoulder, but as it does volume remains low.
The right shoulder is NEVER higher than the head, although it may be the same price. |
|
|
What happens to volume in the fall from the right shoulder into a correct phase occurs?
|
Volume expands as sellers come into the market to dump the stock.
|
|
|
When is a head and shoulders pattern confirmed?
|
Once the neckline of the pattern is broken by the fall from the right shoulder.
|
|
|
How does a double top form?
|
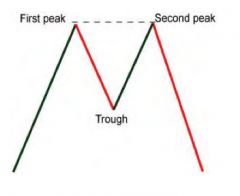
A double top forms as the stock moves into a peak on rising volume before falling away to form a trough. The stock then returns to an uptrend to form another peak at or near the price of the first peak, usually on lower volume.
Preferably the second peak should be equal or lower than the first (within 1-2% tolerance) - want to see a bearish pattern. |
|
|
What kind of pattern is a double top or triple top?
|
A distribution pattern
|
|
|
What is a triple top?
|
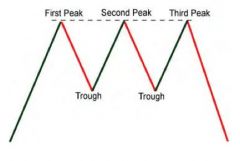
A triple top is the same as a double top except that it has 3 peaks instead of 2.
For a triple top to occur, a double top must already exist; consequently, a triple top is an extended distribution phase. |
|
|
What are the rules for deciding whether a double or triple top has formed?
|
1. There must be a range between each of the peaks and you must see a V shape with 2 peaks and 1 trough in a double top and a W shape with 3 peaks and 2 tops in a triple top.
2. The further part in time the peaks, the stronger the pattern. 3. The price between the peaks should be close with a tolerance of a few percent - the close the tops the smaller the tolerance. If the tops are a few weeks apart they should be around the same price but if they are years apart they should be within 2-3% of each other. |
|
|
When is a double top confirmed?
|
Industry experts say a double top is not confirmed until the low between the tops is broken, however this can lead to a lot of lost profit.
It is recommended that once the second peak is confirmed then the double top is confirmed and you should exit your position. |
|
|
Once a stock confirms a topping pattern, when should you exit?
|
Wait for the week to close, then sell at market open the following Monday.
This avoid the situation where the bar that forms the second or third peak turns into an outside bar and negates the pattern. |
|
|
What are double bottoms?
|
Reversal patterns that form in periods of accumulation.
|
|
|
What can double bottoms indicate and why are they less consistent than double tops?
|
They can indicate an imminent reversal in the trend. However, because they form during periods when there is negative perception of the market and investors do not want to buy downtrending stocks, they are less consistent.
|
|
|
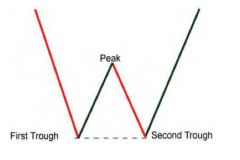
How does a double bottom form?
|
The stock falls on into a trough on expanded volume before rising to a peak and then returning to a downtrend to form another trough at or near the price of the first trough.
|
|
|
What is a triple bottom?
|
A triple bottom is an extended accumulation phase characterised by a double bottom that rises to a second peak before falling to form a third trough.
A triple bottom is a very bullish pattern, which you will normally see a stock rise strongly out of. |
|
|
What are the rules relating to the formation of double and triple bottoms?
|
1. For a double or triple bottom to exist there must be a range between each of the troughs and you must see an inverted V shape with 2 troughs and 1 peak in a double bottom or 3 troughs and 2 peaks in a triple bottom (M shape).
2. The further apart in time the 2 troughs, the stronger the pattern. 3. The price of the 2 troughs should be close and the tolerance depends on how close in time the troughs occur. |
|
|
When is a double bottom confirmed?
|
While industry experts suggest that the double bottom is not confirmed until the peak between the two bottoms is broken, this would produce a late entry into the stock and limit potential profits.
It is therefore recommended that once the 2nd trough is confirmed, the pattern is confirmed and you should enter the trade. |
|
|
When is the second trough of a double bottom confirmed?
|
Only when you see an up move - you must see an up bar - it may be the bar following the trough or it may be several bars latter.
Until price confirms it has stopped falling a double bottom is not confirmed. |
|
|
When is a triple bottom confirmed?
|
According to industry experts, not until the second peak has been broken but again this causes a late entry.
It is recommended that the triple bottom is confirmed on confirmation of the third trough - there must be an up move after the trough. |
|
|
What do reversal patterns normally indicate?
|
A change in the direction of the longer term move is likely to occur - they have the effect of halting and then reversing the trend.
|
|
|
Where do head and shoulders patterns occur?
|
A head and shoulders is a reversal pattern that is seen at market peaks (distribution) and troughs (accumulation).
|
|
|
Why must you wait for the down bar to complete following a double or triple top?
|
You should always wait for the down bar to complete for the week because quite often a stock will only briefly trade lower before immediately reversing to form an outside bar making a higher high than the second or third top and therefore negating the double or triple top.
|
|
|
Reversal patterns are normally the first or the last signal you get to alert you to exit a trade?
|
The last - it is almost impossible for a stock not to provide at least one, if not more, sell signals before the confirmation of a reversal pattern.
|
|
|
If you are still holding a stock once a reversal pattern is confirmed...
|
...you have most likely missed one or more of the prior sell signals and you should therefore sell the stock immediately.
|
|
|
How can we use a head and shoulders pattern?
|
We can project the likely fall from the head and shoulders pattern to indicate where the stock will find support.
We do this by calculating the range from the top of the head to the neckline - generally the stock will fall another 100% of this range from the neckline. |
|
|
How do we use volume to help analyse the formation of the head and shoulders pattern?
|
Volume should expand when price moves in the direction of a longer term trend and contracts when price moves in the opposite direction to the longer term trend.
Thus we can expect that 1. Volume will expand into the peak of the left shoulder and then contract as the price corrects. 2. Volume will again expand into the head and will immediately contract and then remain at average levels as price falls away - indicating that the bears are in control. 3. Volume will expand as price falls away from the right shoulder. |
|
|
When using volume to analyse a head and shoulders pattern, we use it to?
|
Confirm the strength of the pattern rather than as a trading tool.
|
|
|
How do we calculate the likely fall from a double top?
|
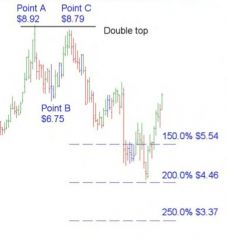
Calculate the range from the first top to the low between the 2 tops. Price will generally fall to between 150% and 200% of that range subtracted from the second peak.
|
|
|
How do we project the likely rise up from a double bottom?
|
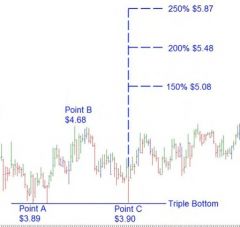
Calculate the range by subtracting the first trough from the high in the middle of the pattern. Generally a stock will rise 150% to 250% of this range from the second trough of the pattern. (Calculate the 150%, 200% and 250% levels).
|
|
|
If you understand reversal signals...
|
you will be able to determine where a trend is likely to turn so as to fine tune your entry and exit positions.
|
|
|
Where a reversal signal forms on a chart indicates...
|
...the likely probability of it reversing the trend.
|
|
|
The strength of a reversal signal depends upon?
|
The particular pattern formation and the price level at which it occurs.
|
|
|
Reversal signals normally form over how many bars?
|
1 - 4 bars - therefore on a daily chart they will form in less than a week and on a weekly chart in less than a month.
|
|
|
What is an Open Close Reversal?
|
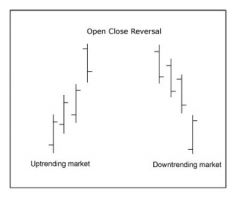
Uptrend: a bar with a higher high and a higher low (green up bar) with the open near the high and the close near the low but ABOVE the previous bars close.
Downtrend: A bar with a lower high and a lower low (red down bar) with the open near the low and the close near the high but BELOW the previous bars close. |
|
|
What is a Closing Price Reversal or Reversal Pattern?
|
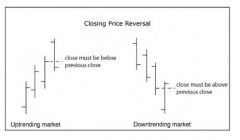
Uptrend: an (up) bar with a higher high and a higher low with the open near the high and the close near the low but BELOW the previous bars close.
Downtrend: a (down) bar with a lower high and a lower low with the open near the low and the close near the high but ABOVE the previous bars close. |
|
|
What is an Outside Reversal Pattern?
|
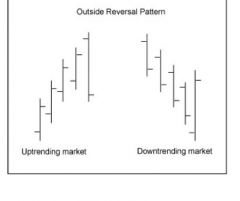
Uptrend: an (outside) bar with a higher high and a lower low with the open above the previous close and the close below the previous bars low.
Downtrend: an (outside) bar with a higher high and a lower low with the open below the previous close and the close above the previous bars high. |
|
|
What is a Hook Reversal pattern?
|
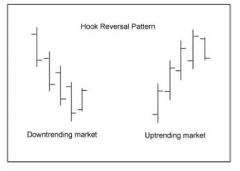
Uptrend: an (inside) bar with a lower high and higher low with the open near the high and the close near the low.
Downtrend: an (inside) bar with a lower high and a higher low with the open near the low and the close near the high. |
|
|
What is an Island Reversal Pattern?
|
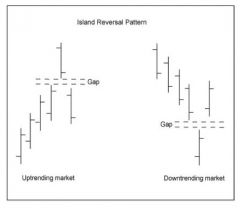
Uptrend: an (up) bar with a higher high and a higher low with a gap between the previous bars high and the current low of the previous bar with the close lower than the open.
Downtrend: a (down) bar with a lower high and lower low with a gap between the current high and the previous bars low, followed by a bar with a gap between its low and the high of the previous bar with the close higher than the open. The more significant the gap, the stronger the signal will be. If there is an open close reversal in the first 2 bars, it serves as additional warning. |
|
|
What is a Pivot Point Reversal Pattern?
|
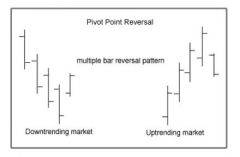
Uptrend: an (up) bar with a higher high and a higher low, followed by a (down) bar with a lower high and a lower low. The current close should be lower than the open and below the previous bars low.
Downtrend: a (down) bar with a lower high and a lower low, followed by an (up) bar with a higher high and a higher low. The current close should be higher than the open and above the previous bars high. |
|
|
What is a Complex Pivot Reversal Pattern?
|
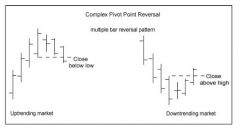
Uptrend: the same as a pivot point reversal except it is a multi bar pattern and is confirmed once the current close is lower than the low of the high bar.
Downtrend: the same as a pivot point reversal except is is a multi bar pattern and is confirmed once the current close is higher than the high of the low bar. |
|
|
What is a Two Bar Reversal Pattern?
|
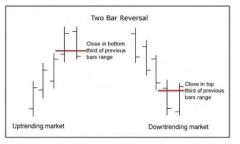
Uptrend: both bars in the pattern have an equal high and the current close is in the lower third of the range of the previous bar.
Downtrend: both bars in the pattern have an equal low and the current close is in the higher third of the range of the previous bar. |