Reading...
![]()
Play button
![]()
Play button
![]()
Use LEFT and RIGHT arrow keys to navigate between flashcards;
Use UP and DOWN arrow keys to flip the card;
H to show hint;
A reads text to speech;
37 Cards in this Set
- Front
- Back
|
What are trend lines?
|
Trend lines measure the rate of change in the price of a stock so they are indication of the momentum of buyers & sellers. They provide a visual representation of the limits of the buyers & sellers.
|
|
|
What does a down trend line do?
|
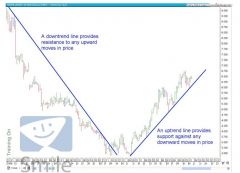
It provides resistance to the price moving up or the point at which the buyers exhaust themselves before the sellers commence selling the stock to take the price lower once again.
|
|
|
What does an up trend line do?
|
It provides support for the price from moving down further. It is the point at which buyers commence buying the stock to take the price up once again.
|
|
|
What is Golden Rule 1?
|
Trends and Trend Lines are different - you can have a trend in place but be unable to draw a trend line BUT you can NEVER draw a valid trend line unless there is a trend in place.
|
|
|
What is Golden Rule 2?
|
You must have a trend in accordance with Gann Trend Theory - you cannot draw a trend line until you have 12 or more bars that move in the direction of the trend on the WEEKLY chart.
This rule does not apply if you are drawing a trend line on a monthly chart. |
|
|
What is Golden Rule 3?
|
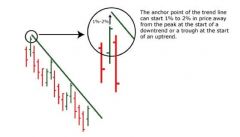
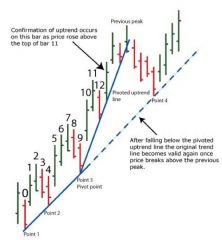
When drawing a trend line you must start from the highest peak in a downtrend or the lowest trough in an uptrend (ie the trend line starts from bar 0). This is known at the turning point of the trend because it is the point where the trend changes direction.
Must make sure that you do not start drawing in the middle of a movement - squeeze up the chart to make sure you are at the actual turning point. You can start 1-2% in price away from the trough/peak to achieve the line of best fit but no more than that. |
|
|
What is the turning point of the trend?
|
The point at which the trend changes direction - it is the highest peak in a downtrend and the lowest trough in an an uptrend.
|
|
|
Where can the anchor point of a trend line be?
|
Slightly above or below the peak or trough (1-2% in price) to get the line of best fit.
|
|
|
What is Golden Rule 4?
|
You can only draw a trend line if you have 3 peaks for a down trend or 3 troughs for an uptrend. You must wait for the 3rd peak to be confirmed.
This will be easy if you first mark the swing highs and lows on the chart. |
|
|
What is Golden Rule 5?
|
The trend line must touch all 3 of the peaks or troughs within 1-2% for a line of best fit.
|
|
|
What is Golden Rule 6?
|
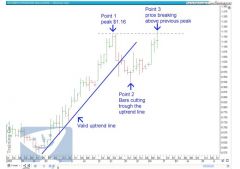
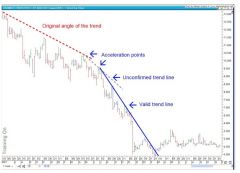
Technically once you have a valid trend line either up or down, you cannot adjust it so that the angle or gradient becomes flatter.
However, you can adjust the gradient of the trend line IF the following 2 conditions occur: 1. Bars break the trend line by cutting through it; and 2. The trend has continued by rising above the previous peak prior to the bars that cut it. If so, you can go back and apply a new trend line provided it meets rules 3, 4 and 5. The new trend line should incorporate the peak or trough that was created by price breaking through the original line. |
|
|
If you have drawn a valid trend line and bars trade through the trend line, what should you do?
|
Check to see if your entry/exit rules have been met and, if so, trade.
2. Wait to see if the trend continues to form a longer term trend by trading above the previous peak or below the previous trough prior to the breaking of the line. If it does, look to see if you can draw a new trend line from the original pivot point - this line will be flatter in gradient and must meet all the other golden rules. |
|
|
As soon as a trend line is broken and GR 6 is enacted, what should you do?
|
Go back to the original turning point of the trend and draw a new trend line from that point (provided it meets all the rules).
|
|
|
If you are able to draw a flatter trend line in accordance with GR6, what happens to the previous trend line?
|
It becomes invalid. However there may be one or more previous trend lines that may be valid or can be extended to become a valid trend line.
|
|
|
Explain how to draw a down trend line.
|
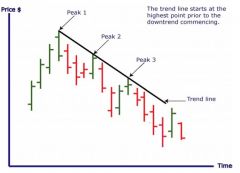
1. Identify that there is a trend in place by identifying 12 or more bars on the weekly chart moving in the direction of the trend.
2. Then identify 3 peaks on which to draw the trend line - the line does not have to touch the peaks but they should be no more than 1-2% away. |
|
|
What does a downtrend line mean for our analysis?
|
The down trend line provides comfort in knowing that there is resistance in the price when a stock reaches the line. When a stock is below the line, you would not own it as it is in a downtrend and has a high probability of falling further. When it breaks above the downtrend line, there is a high probability that the trend is most likely changing from down to up.
|
|
|
Explain how to draw an up trend line.
|
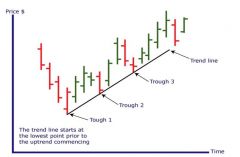
1. First identify that there is a trend in place by finding 12 or more bars on the weekly chart that are moving upwards.
2. Identify 3 troughs on which to draw a valid trend line beginning at the lowest low in price. The line of best fit does not have to touch each trough but should fall within 1-2% of it. |
|
|
What does an up trend line mean for our analysis?
|
An up trend line provides comfort in knowing that there is support in the price when a stock reaches the line. While the stock is above the uptrend line, it has a high probability of continuing its uptrend. This probability decreases significantly once it breaks below the uptrend line and you should not continue to own it if it fulfils the rules for selling on trend lines.
|
|
|
Explain acceleration.
|
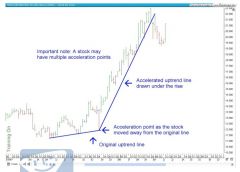
If momentum increases from the prevailing side in a trend, the rate at which the price changes increases as well.
If there is competition amongst buyers, the price of a stock will be pushed up; if for some reason a lot more buyers enter the stock, the price will increase more rapidly. As a consequence, the steepness of the trend will also increase and you will need to adjust the gradient of the trend line accordingly. |
|
|
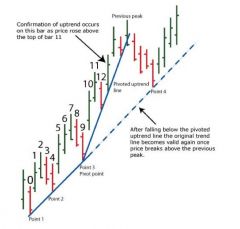
What is a pivot or acceleration point?
|
The point where the rate of change in price increases - it is at this point where you need to adjust the angle of your trend line to follow the new trend.
|
|
|
Which rule DOES NOT apply when drawing a new trend line from a pivot point?
|
GR 2 - you do not need to have 12 or more weekly bars in order to draw an accelerated trend line. However, all of the other golden rules still apply.
GR2 only relates to the turning point of the trend. |
|
|
Why must you always draw the STEEPEST valid trend line that you can?
|
So that the tend line hugs the trend and provides the earliest possible entry and exit into and out of a stock.
|
|
|
During a trend, how often will you need to adjust the trend line?
|
It is quite common to adjust at least once if not twice during a trend.
Drawing a third trend line typically signals the exhaustion of the trend and is usually much steeper than the previous 2 trend lines. On rare occasions you may need to adjust your trend line a fourth time, which will signal the last phase of the trend. |
|
|
What happens to the original trend line after a new flatter trend line is drawn in accordance with GR 6?
|
A trend may accelerate away from a valid trend line, confirming a new steeper trend line, only for the trend to fail and the angle of the trend to revert back to the angle of original trend line.
|
|
|
How do we use trend lines to trade?
|
Because a trend line is a momentum indicator and shows you where the price finds support or resistance, you can use it to buy or sell once that support/resistance line is broken. A trend line will give you 60-70% success without any other confirmation making it a successful way to trade.
|
|
|
What are the 2 main entry rules using trend lines?
|
1. Buy when there are 2 consecutive closes above a downtrend line on a weekly bar chart.
OR 2. When 2 consecutive weekly bars are clearly above the down trend line on a weekly chart. |
|
|
What is the exit rule when using trend lines?
|
Exit when there are 2 consecutive closes below the uptrend line on a weekly chart.
|
|
|
What price do we base our decision to buy and sell on?
|
The closing price because this alerts us as to who is in control of the market.
|
|
|
Name the 4 functions of trend lines:
|
1. An indication of the momentum of the buyers & sellers.
2. Provide a measure of support or resistance to a stock moving up or down. 3. A signal as to when to buy or sell. 4. The ability to act as a trailing stop loss. |
|
|
Where else can you exit a trade using trend lines?
|
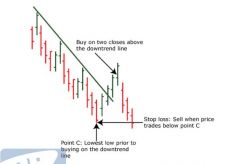
If you enter a trade after 2 consecutive closes above the down trend line but price then trades below the previous low (such that GR6 now applies), sell when the price trades below the previous low prior to price breaking above the line.
|
|
|
Name 4 common mistakes when drawing trend lines:
|
1. Failing to wait until GR2 is in place - must have 12 bars on weekly chart;
2. Failing to wait until GR4 is met - must have 3 peaks or troughs 3. Pivoting from half way up a trend at a shallower angle than original trend. 4. Drawing the line across the bottom of bars instead of across the troughs - the bottom of a bar is not necessarily a trough. |
|
|
At what point in a new uptrend would we know that the uptrend had failed?
|
When a stock makes a lower low than the previous low because according to Dow Theory you cannot have a lower low and still be in an uptrend.
|