![]()
![]()
![]()
Use LEFT and RIGHT arrow keys to navigate between flashcards;
Use UP and DOWN arrow keys to flip the card;
H to show hint;
A reads text to speech;
76 Cards in this Set
- Front
- Back
|
Three components of a typical parking study |
Supply/Demand Analysis Site Alternatives Analysis Financial Analysis |
|
|
Techniques for estimating parking demand |
1. Recommended parking ratios (per code, industry standards etc.) 2. Estimated per-person trips at peak hours - critical differences between using the design day and median days...recommendations look to the 85th percentile of peak-hour parking 3. Effective Supply - Downward adjustment 10-15%. 85th-95th percentile full. Goal is to provide enough spaces so that the perception is that there is still available parking |
|
|
Ways to fund shared parking |
1. Fees in Lieu 2. Special Tax districts 3. Land Banking 4. Administratively Approved Deviations |
|
|
AASHTO ANSI ADA ADAAG IBC ATBCB UFAS PROWAG |
American Association of State Highway Transportation Officials American National Standards Institute Americans with Disabilities Act (titles I, II, III) International Building Code Architectural and Transportation Barriers Compliance Board Uniform Federal Accessibility Standards Proposed Guidelines for pedestrian facilities in the Public Right-of-Way |
|
|
Landforms at the regional scale Landforms at the site scale Landforms at the smallest scale |
"Macrolandforms" - Mountains, valleys, hills "Microlandforms" - berms, mounds, grade/level "Minilandforms" - undulations, ripples, texture |
|
|
Southeastern US - Topographic Regions |
Piedmont, Plain, Mountains |
|
|
Landscape location & topography influence |
Italian - Villas in steep hillsides, water features French - Ornate patterns on flat landscapes English - Rolling hills, curves, streams/lakes |
|
|
Max Slope for shrubs only Max slope to maintain turf |
10% 3% |
|
|
Min slope for positive drainage |
1% - paved areas 2% - landscaped areas 5% - typical away from buildings |
|
|
Seasons & Wind Exposure Winter Summer |
WINTER: NW Slopes = Cold winds SE Slopes = protected SUMMER: SW slopes = cooling effect breeze |
|
|
Most desirable slope aspect for development |
Southeast - Protection from winter wind - Indirect heat from afternoon sun - Exposure to summer breeze winds - Exposure to winter sun |
|
|
Three goals for grading |
1. Establish proper drainage 2. Modify site to accommodate program needs 3. Create aesthetically pleasing ground plane |
|
|
Convex slope & landform |
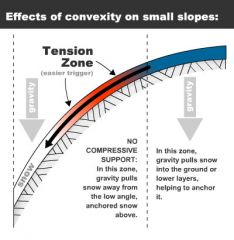
High point, mound |
|
|
Concave slope & landform |
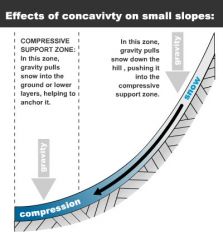
Low point, depression |
|
|
Interpolation |
Proportional relationship of spot elevation between two contour lines. horizontal and vertical are the same proportion (ie. if horiz distance for spot elevation is one-fifth of the total dist apart, it is also one-fifth of the vertical distance between contours) |
|
|
Ratio Slope Guidelines |
2:1 (50%) Absolute max slope to avoid erosion - must be planted 3:1 (33%) Absolute max slope for planting areas 4:1 (25%) Absolute max maintainable by mower |
|
|
Sustainability Practices |
Practice a heirarchy pricinciples: Preservation, Conservation, Regeneration |
|
|
Sustainability Practices |
Design in response to economic, environmental, and cultural conditions (local, regional, global) |
|
|
Sustainability Practices |
Foster collaborative, ethical design approach among stakeholders, clients, manufacturers..think long-term about environmental justice |
|
|
5 areas of LEED concrern |
1. Site planning and design 2. Energy usage 3. Water management 4. Materials resources and waste 5. Indoor environmental quality |
|
|
LEED Design Considerations - BUILDINGS |
- Building position for solar access - Materials Selection & their life cycle - Design for energy efficiency/performance - Materials & equipment for indoor air quality - Minimize construction & operations waste - Weigh capital cost against operations $ savings - Use of published LEED strategies |
|
|
LEED Sustainable Sites Considerations - SITE |
- Landscape for energy efficiency - Rethink grounds, maintenance, toxins - Reduce water consumption - Site specific issues awareness (i.e. soils) - Accommodating access, public transportation - Using site features for building performance - Building site for solar/seasonal influence - Maximizing local energy alts. |
|
|
BEES life cycle assessment model 10 impacts of building materials (Building for Environmental and Economic Sustainability) |
1. Global warming potential 2. Acidification potential 3. Eutrophication potential 4. Natural resource depletion 5. Indoor Air quality impacts 6. Solid Waste impacts 7. Smog 8. Ecological toxicity 9, Human toxicity 10. Ozone depletion |
|
|
Critical elements of Site Analysis / Assessment |
Location/Context Topography USDA Plant Hardiness Zones FEMA Maps Aerial Photogrammetry Historical aerial photography USDA Soil survey Zoning regs Utility mapping Historical / cultural data |
|
|
Hazardous Soil conditions: cracking of walks, foundation & retaining wall failures |
Expansive Soils - Dry characteristics: hard, cut leaves shiny surface, irregular crack patterns - Wet characteristics: sticky, shiny when cut, develops thick coating on machinery/shoes |
|
|
Liquefaction - condition and type of soils |
Condition where solid soil can turn mushy when vibrated (earthquakes). Associated with fine to medium grained sands/silts. |
|
|
Liquefaction - Risk |
- Soils with higher density = lower risk - Clay content of 15% or more = adequate protection |
|
|
Ecological Services Analysis of site |
- ID vegetative communities - Habitat (seasonal & year-round) -Presence of colonial birds - Hydrology - Soils - Local Climate |
|
|
Environmental Site Assessment (ESA) |
Assesses environmental risk for planning and development. Often required by lenders |
|
|
10 Characteristics of a quality community (Hylton 1995) |
1. A Sense of Place 2. Human Scale 3. Self-contained neighborhoods 4. Diversity 5. Transit-friendly design 6. Trees 7. Alleys and parking lots to rear 8. Humane architecture 9. Outdoor rooms 10. Maintenance and safety |
|
|
Lot layout alternatives |
- Grid Layout - Deep narrow lots - Wide shallow - Alley Houses - Z-Lots (Zero Lot Line) |
|
|
Cluster Design |
Development pattern to cluster units on a tract. Density bonuses are often incentives to developers to preserve open space |
|
|
Design Guidelines for safety and security |
Crime Prevention through environmental design (CPTED) - Key to involve community in design process |
|
|
CPTED strategies |
- Lighting - Lines of sight along streets/bldgs - plant material consciousness - traffic calming - Look for escape routes - Vandal-proof materials - Evidence of formal and informal surveillance - Restrict vehicle movement |
|
|
LIGHTING - Florescent |
70 lumens 6000 life hours good color purity, white Affected by cold weather |
|
|
LIGHTING - High pressure sodium |
130 lumens 16,000 life hours Poor color purity, yellow/orange Washes out colors in landscape |
|
|
LIGHTING - Low pressure sodium |
190 lumens 11,000 life hours Poor color purity, pink/orange Washes our colors in landscape (gray) |
|
|
LIGHTING - Metal Halide |
90 lumens
14,000 life hours cool white, good color purity |
|
|
LIGHTING - Mercury Vapor |
55 lumens 24,000 life hours cool white Strong in blue-green spectrum |
|
|
LIGHTING - Tungsten-iodine |
18-20 lumens 2000 life hours Good color purity (deluxe white) |
|
|
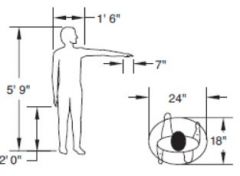
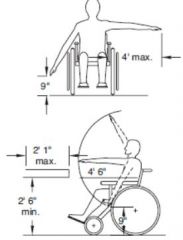
Human Dimensions - standing |
|
|
|
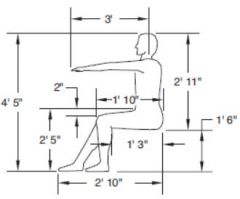
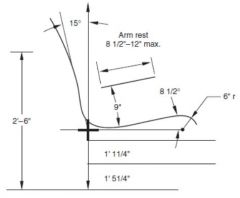
Human Dimensions - Sitting |
|
|
|
Human Dimensions - Wheelchair |
|
|
|
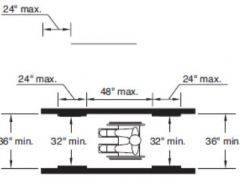
Accessibility - Path dimensions |
|
|
|
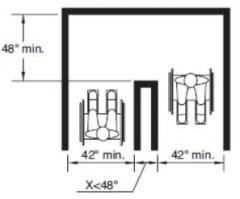
Accessibility -Wheelchair turnaround (42" wide path) |
|
|
|
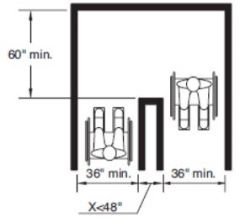
Accessibility - Wheelchair turnaround (36" path) |
|
|
|
Equation to determine ideal sidewalk width |
W = V(M)/S W = width of path V = Volume in person/minute M = Sf allowed per person S = Walking speed in ft. / min (avg. 4 ft per sec) |
|
|
Sidewalk Grades |
Min. 1% cross slope (drainage), not to exceed 3% Longitudinal slope of 3% or less is best Avoid slopes more than 5% in icy conditions |
|
|
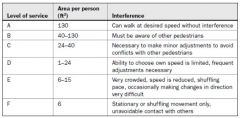
Level of service - Sidewalks |
|
|
|
Walks exceeding 5% Max dist. at 8.33% on a ramp before a landing |
Considered a Ramp Every 30' |
|
|
STAIR DESIGN 2R+T = 26-27" 2(Riser ht.) + Tread height |
- Min. height 4.5 in. - Max. 7 in. - Min. 2% pitch for drainage - Min. 3 steps preferred - Provide 5' or less grade change b/t landings - Visual signals for tread edges on nosing (i.e. relief, chamfer) |
|
|
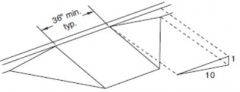
RAMP DESIGN |
- Slopes 1:12 (8.33%) and 1:16 (6.2%) - Not to exceed 30" height, 30' run - Cross slope not to exceed 1:50 (2%) |
|
|
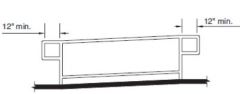
Ramp handrail extension - 12" at landings |
|
|
|
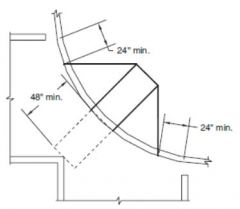
Ramp Corner Dimensions |
|
|
|
Typical Ramp Dimensions |
|
|
|
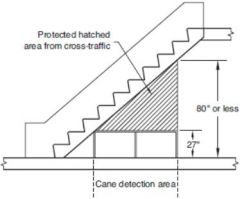
Min vertical clearance protection overhead protection (i.e. Under stairs) |
|
|
|
Playground Design Dimensions |
- Locate several hundred feet from the street - Sized 70sf/child or 21sf per family - 2000sf playground serves approx. 100 families - 50-60% of the area should be turf - 12ft between pieces of equipment - Avoid overlapping fall zones - Shock absorbing materials - Include areas for observation/benches/strollers |
|
|
"Critical Height" in playgrounds |
Maximum height of a fall from which a life-threatening head injury would not be expected. Examples: Swings - ht from 90degrees at rest position Slides - ht from top of platform guard rail |
|
|
Two types of safe playground surfaces |
1. Unitary materials (i.e. foam-like mats or pour) 2. Loose fill materials (rubber or wood mulch) |
|
|
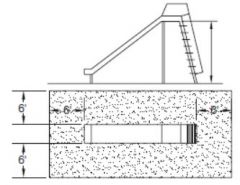
PLAYGROUND Slide Fall Zone |
|
|
|
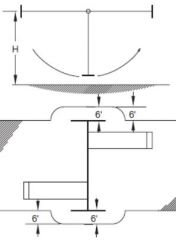
PLAYGROUND Swing Fall zone - 360 deg. movement |
|
|
|
PLAYGROUND Swing fall zone - typical 180 deg. movement |
|
|
|
Three types of bicycle trips |
1. Commuter 2. Recreational 3. Neighborhood |
|
|
Bicycle design grades |
- 3% ideal, limit 4-5% max - Grades over 5%, generally require standing - Grades of 8% or more, cyclists often dismount - Wider surfaces on steeper sections for passing |
|
|
Seating - Bench Dimensions |
|
|
|
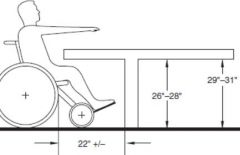
Seating - Table dimensions |
|
|
|
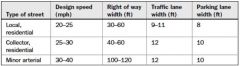
Complete Streets Dims - Design table for local, collector, and minor arterial streets |
|
|
|
Suitable Slopes Steep Moderate Gradual |
Steep (greater than 15%) - Preclude cost-effective construction Moderate (5%-15%) - Suitable for some structures, split level or terraced Gradual (less than 5%) - Ideal for most land uses: parking, recreation fields, roads. Minimize construction cost and impacts to land |
|
|
Good rules of thumb for siting road access point |
Sight distance triangle: 50' Distance to next intersection: 100' Intersection grade: 3% or less |
|
|
Parking Spaces Required for uses (examples) |
SPACES REQ'D Shopping center: 5 per 1,000 SF Theater: 1 per 4 seats Bowling Alley: 4 per Lane Hotel: 1 per unit |
|
|
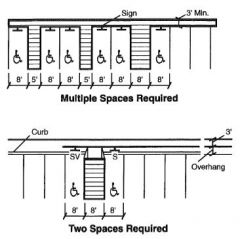
Parking dimensions for Accessible spaces (Car and Van) |
|
|
|
Walk grades and distance required for ramps |
0-5% - any distance without landing 5%-8.33% - Landing 200' 8.33% - 10.1% - Landing 30' 10.1% - 12% - Landing 10' |
|
|
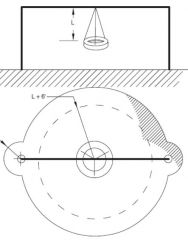
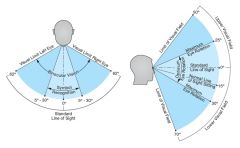
Cone of vision: Vertical and Horizontal ranges |
|
|
|
Roadway Driver's height for Sight Distance Calculations |
3.5' above road surface |
|
|
Stopping sight distance calculation height of object to be avoided |
2' object height |
|
|
Four types of Roadway alignment curves |
Simple: Tangent - Curve - Tangent Compound: Tangent - Curve - curve - Tangent Reverse: Tangent - curve (1 way) - tangent - curve (2 way) Broken-Back: Tangent - cuve (1 way) - tangent - curve (1 way) - tangent |