Reading...
![]()
Play button
![]()
Play button
![]()
Use LEFT and RIGHT arrow keys to navigate between flashcards;
Use UP and DOWN arrow keys to flip the card;
H to show hint;
A reads text to speech;
84 Cards in this Set
- Front
- Back
|
The purpose of a phase II clinical trial is to:
A. estimate the toxicity of treatment to be tested. B. estimate the efficacy of treatment to be tested. C. estimate the preclinical toxicity of an experimental agent. D. determine a safe starting dose of an experimental agent. |
Correct answer is B. RATIONALE: A Phase II trial is performed to determine if a drug or treatment has activity against a specific type of tumor.
|
|
|
Three different lung cancer radiation treatments are being assessed for maximum-tolerated dose. This study is an example of what type of clinical trial?
A. Phase I B. Phase II C. Phase III D. Pilot |
Correct answer is A. RATIONALE: The objective of a phase I trial is to determine an appropriate dose for use in a phase II or phase III trial.
|
|
|
What is the best method for minimizing bias in a national trial comparing two radiation therapy regimens?
A. Randomization B. Patient stratification C. Univariate analysis of prognostic factors D. Multivariate analysis of prognostic factors |
Correct answer is A. RATIONALE: The aim of randomization is to minimize bias.
|
|
|
Which of the following equations is used to determine a positive predictive value?
A. True positive / (True positive + false negative) B. True positive / (True positive + false positive) C. True negative / (True negative + false negative) D. True negative / (True negative + false positive) |
Correct answer is B. RATIONALE: By definition, the positive predictive value is true positive / true + false positives.
|
|
|
Median survival is defined as the:
A. most prevalent time to death in the sample population. B. point in time a survival probability on a Kaplan-Meier curve is 50%. C. median of the survival-time intervals. D. mean of the survival-time intervals. |
Correct answer is B. RATIONALE: The median survival time is the time at which half the subjects have died and half are still alive. It is easy to derive the median survival time from the survival curve by drawing a horizontal line at 50% survival and seeing where it crosses the curve.
|
|
|
What is the probability of being within two standard deviations of the mean for data with an exactly normal distribution?
A. 50% B. 68% C. 95% D. 99% |
Correct answer is C. RATIONALE: The probability of being within 2 SD of the mean is 95%.
|
|
|
Within a target volume, the following 11 absorbed doses in water points (in centigray) represent the prescribed absorbed dose in water:
4500, 4520, 4520, 4540, 4540, 4550, 4540, 4540, 4530, 4510, and 4500. The difference between the mean target volume and the modal target volume of the absorbed dose in water is approximately how many centigray (cGy)? A. 04 cGy B. 10 cGy C. 14 cGy D. 20 cGy |
Correct answer is C. RATIONALE: Requires the resident to distinguish mean target volume from modal target volume of absorbed dose in water.
|
|
|
Which of the following tests is used to determine the difference in survival between two treatment regimens?
A. Chi-square test B. Fisher exact test C. Log-rank test D. Student t test |
Correct answer is C. RATIONALE: The log-rank test is the most common method of comparing independent groups of survival times.
|
|
|
242. What would be the best reason for early termination of a randomized phase III trial?
A. A protocol violation B. An adverse event occurring in one of the treatment arms C. Evidence of one treatment arm showing significant superiority during the trial D. Loss of follow-up of some of the subjects during the trial |
Correct answer is C. RATIONALE: It is important to know that when one treatment arm shows definite superiority during the trial, it is unethical to continue randomization.
|
|
|
The ages of two populations are sampled. One population has a mean age of 40 years and a standard deviation of 3 years. The other population has a mean age of 30 years and a standard deviation of 4 years. What is the likelihood that these two populations are the same in age?
a. <0.05% B. <5% C. >75% D. >95% |
Correct answer is B. RATIONALE: This is a typical t test. The null hypothesis that population A is the same as population B is rejected at p<0.05, as the means are different by at least 2 standard deviations. The separation would have to be far greater to achieve 0.05%, or p<0.0005.
|
|
|
Which of the following statements about clinical trials is true?
A. Unpublished trials should be included in a meta-analysis. B. A phase III trial compares two experimental treatments in a randomized fashion. C. In a phase III clinical trial, all patients who do not receive the intended treatment should be excluded in the analysis. D. Subgroup analysis is a reliable way to analyze a subgroup of patients with some particular characteristics. |
Correct answer is A. RATIONALE: All unpublished trials also should be included in meta-analysis to minimize the effect of publication bias.
|
|
|
Which of the following equations is used to determine specificity?
A. True positive / (True positive + false negative) B. True positive / (True positive + false positive) C. True negative / (True negative + false negative) D. True negative / (True negative + false positive) |
Correct answer is D. RATIONALE: By definition, specificity is true negative / true negative + false positive.
|
|
|
A study using SEER data is conducted to determine whether radiation therapy improves
survival for women with advanced breast cancer. However, approximately 25% of the women who received radiation therapy are reported in the SEER data as not having received radiation therapy. This example represents what type of bias? A. Recall B. Observer C. Misclassification D. Selection |
Correct answer is C. RATIONALE: This item represents an example of misclassification bias,
in which patients who truly received radiation therapy are misclassified as having not received radiation therapy. |
|
|
A clinical trial is conducted to compare the accuracy of a sentinel node biopsy (SNB) to
axillary lymph node dissection (ALND) in women with early breast cancer. The results of the trial are shown below. Positive SNB and positive ALND 083 patients Negative SNB and positive ALND 008 patients Positive SNB and negative ALND 000 patients Negative SNB and negative ALND 166 patients 29. What is the sensitivity of the sentinel node biopsy (SNB)? A. 009% B. 010% C. 091% D. 100% |
Correct answer is C. RATIONALE: Sensitivity refers to the ability of a test to detect disease if it
is present. Sensitivity = a/(a+c)= 83/(83+8). |
|
|
A clinical trial is conducted to compare the accuracy of a sentinel node biopsy (SNB) to
axillary lymph node dissection (ALND) in women with early breast cancer. The results of the trial are shown below. Positive SNB and positive ALND 083 patients Negative SNB and positive ALND 008 patients Positive SNB and negative ALND 000 patients Negative SNB and negative ALND 166 patients 30. What is the false-positive rate for SNB? A. 00% B. 05% C. 09% D. 10% |
Correct answer is A. RATIONALE: The false-positive rate refers to type I (alpha) error, where
a test falsely indicates the presence of disease. False-positive rate = b/(b+d) = 0/(0+166) = 1 – specificity. |
|
|
A clinical trial is conducted to compare the accuracy of a sentinel node biopsy (SNB) to
axillary lymph node dissection (ALND) in women with early breast cancer. The results of the trial are shown below. Positive SNB and positive ALND 083 patients Negative SNB and positive ALND 008 patients Positive SNB and negative ALND 000 patients Negative SNB and negative ALND 166 patients Which of the following values is dependent on the prevalence of positive lymph nodes in the patient population studied? A. Sensitivity B. Positive predictive value C. False-negative rate D. Specificity |
Correct answer is B. RATIONALE: The sensitivity, false-positive rate, false-negative rate, and
specificity are characteristics of the test and do not depend upon characteristics of the population. In contrast, the positive predictive value (PPV) and negative predictive value (NPV) depend on the prevalence of disease in the population of interest. The PPV indicates the proportion of patients who have a positive test and actually have the disease. This can be understood intuitively with the following example: Suppose MRI screening for breast cancer is studied in a population of high-risk women with BRCA mutations and in a population of low-risk women without any major breast cancer risk factors. In the BRCA population, a high proportion of women with a positive MRI will have breast cancer. In contrast, in the low-risk population, a relatively low proportion of women with a positive MRI will have breast cancer. This dependence of the PPV on the prevalence of disease in the population also can be understood mathematically. With some mathematical manipulation, the PPV can be shown to equal the following: PPV = (sensitivity*prevalence)/[sensitivity*prevalence + false positive rate*(1- prevalence)]. This is Bayes' theorem. |
|
|
Which of the following types of ratio represents an estimate of relative risk calculated in
case-controlled studies? A. Odds B. Relative risk C. Hazard D. Critical |
Correct answer is A. RATIONALE: Odds ratio is an estimate of the relative risk calculated in
case-controlled studies. It is the odds that a patient was exposed to a given risk factor divided by the odds that a control was exposed to the risk factor. The relative risk ratio is the incidence of a given disease in exposed or at risk persons to the incidence of the disease in unexposed persons. The relative risk ratio is calculated in cohort or prospective studies. The hazard ratio is similar to the risk ratio. The hazard ratio is the ratio of risk of the outcome (such as death) occurring at any time in one group compared with another group. The critical ratio is a term for the z score used in statistical tests. Reference: Dawson B and Trapp RG. Basic and Clinical Biostatistics, 4th edition. |
|
|
Which of the following statistical terms is a measure of spread?
A. Median B. Variance C. p value D. Mean |
Correct answer is B. RATIONALE: Mean and median are both measures of location. Variance
is a measure of spread. |
|
|
In testing the null hypothesis, a Type II error occurs if one:
A. fails to reject the null hypothesis when it is false. B. rejects the null hypothesis when it is really true. C. concludes there is a difference when no difference exists. D. detects a difference when a difference exists. |
Correct answer is A. RATIONALE: A type I (
|
|
|
177. Which of the following is used as the first step to assess the degree of association
between two continuous variables? A. Bar chart B. Odds ratio C. Scatter plot D. Cox's regression |
Correct answer is C. RATIONALE: The first step in assessing association should be a scatter
plot; Spearman or Pearson correlation coefficients can then be used to quantify the degree of association. |
|
|
A resident is conducting a clinical study to determine whether the rectal V70 predicts
the risk of radiation proctitis for patients treated with prostate IMRT. The dataset has 20 covariates, which include variables regarding the clinical history, pathology, and dose-volume histogram. 228. What is the alternative hypothesis for this study? A. None of the 20 covariates predicts the risk of radiation proctitis. B. At least one of the 20 covariates predicts the risk of radiation proctitis. C. The rectal V70 does not predict the risk of radiation proctitis. D. The rectal V70 predicts the risk of radiation proctitis. |
Correct answer is D. RATIONALE: In statistics, a null hypothesis is a hypothesis set up to be
refuted (or nullified) to support an alternate hypothesis. When used, the null hypothesis is presumed true until statistical evidence in the form of a hypothesis test indicates otherwise. In medicine, the null hypothesis is used to test differences in treatment and control groups, and the assumption is that no difference exists between the two groups for the variable being compared. Therefore, for the study presented in this item, the alternative hypothesis is option D. |
|
|
A resident is conducting a clinical study to determine whether the rectal V70 predicts
the risk of radiation proctitis for patients treated with prostate IMRT. The dataset has 20 covariates, which include variables regarding the clinical history, pathology, and dose-volume histogram. What is the probability based on chance alone that at least one of the 20 covariates correlates with the risk of radiation proctitis at P <0.05? A. 064% B. 080% C. 084% D. 100% |
Correct answer is A. RATIONALE: This question highlights the problem of multiple
comparisons. For each covariate, based on chance alone, the probability of not finding a significant association between the covariate and outcome is 0.95, assuming that the P-value for statistical significance is P <0.05. For 20 covariates, the probability of not finding a significant association between any of the covariates and the outcome is 0.95 raised to the 20th power, which equals 0.36, or 36%. Conversely, the probability that at least one covariate is associated with the outcome at P <0.05 is 1 – 0.36 which equals 0.64, or 64%. |
|
|
A retrospective chart review is conducted to compare xerostomia among patients treated
with IMRT versus 3D conformal radiation. Data on xerostomia is determined by reviewing the follow-up notes of the treating physician. The treating physician is a very enthusiastic believer in IMRT and tends to minimize toxicity in follow-up notes on patients receiving IMRT. This example represents what type of bias? A. Recall B. Observer C. Misclassification D. Selection |
Correct answer is B. RATIONALE: In this case, the observer was biased in favor of IMRT, and
thus, IMRT may appear to be a better treatment even if it is not truly a better treatment. This is a major limitation of retrospective chart reviews that seek to assess treatment-related toxicity. |
|
|
Which of the following statistical procedures determines whether any difference exists
among two or more groups of subjects on one or more factors? A. Paired t test B. Independent-groups t test C. Cox proportional hazard model D. Analysis of variance |
Correct answer is D. RATIONALE: Analysis of variance (ANOVA) is a statistical procedure that
determines whether any differences exist among two or more groups of subjects on one (oneway ANOVA) or more factors (two-way ANOVA). A paired t test compares the difference or change in a numerical variable observed for two paired or matched groups. Independent-groups t test (two-sample t test) is used to test the null hypothesis that two independent or unrelated groups have the same mean. Cox proportional hazard model is a regression method used when the outcome is censored and the regression coefficients are interpreted as adjusted relative risk or odds ratio. Reference: Dawson B and Trapp RG. Basic and Clinical Biostatistics. 4th edition. McGraw Hill. |
|
|
What percentage of observations would lie between the mean and 2 standard
deviations (SD) if the distribution of the observations was normally distributed? A. 50% B. 67% C. 95% D. 99.7% |
Correct answer is C. RATIONALE: If the distribution is normally distributed or bell-shaped,
then approximately 67% of the observations lie between the mean and +/–1 SD; 95% of the observations lie between the mean and +/–2 SD; and 99.7% of the observations lie between the mean and +/–3 SD. Dawson B and Trapp RG. Basic and Clinical Biostatistics. 4th edition, p 31. |
|
|
Specificity is defined as the probability of a:
A. true positive. B. true negative. C. false positive. D. false negative. |
Correct answer is B. RATIONALE: Specificity is the proportion of time that a test is negative in
patients who do not have the disease or condition. Therefore, it is the probability of having a true negative. False + sample rate is the probability of a false positive or P(predict yes/no); False – sample rate is the probability of a false negative or P(predict no/yes); sensitivity is the probability of a true positive or P(predict yes/yes); and specificity is the probability of a true negative or P(predict no/no). Reference: Riffenburgh, RH. Statistics in Medicine. 2nd edition. p 543. |
|
|
The power of a statistical test is the probability that the null hypothesis is:
A. true. B. false. C. rejected when it is true. D. rejected when it is false. |
Correct answer is D. RATIONALE: This is the definition of statistical power.
|
|
|
The null hypothesis that the hazard ratio equals 1 can be tested using which of the following regression analysis methods?
A. Cox B. Logistic C. Polynomial D. Multiple linear |
Correct answer is A. RATIONALE: Cox regression models are focused on hazard ratios, whereas the other regression model options provide information about odds ratios or mean values.
|
|
|
A false-positive occurs when test results are:
A. positive for the presence of disease but no disease is present. B. negative for the presence of disease but the disease is present. C. positive for the presence of disease and the disease is present. D. negative for the presence of disease and no disease is present. |
Correct answer is A. RATIONALE: False-positive results occur when the results are positive for the presence of disease, but the patient does not have the disease.
|
|
|
108. Which of the following is used to decide when a diagnostic test should be ordered?
A. Central limit theorem B. Inferential statistics C. Threshold model D. Level of significance |
Correct answer is C. RATIONALE: The threshold model is used to decide when a diagnostic test should be ordered, as opposed to doing nothing or treating the patient without ordering the test. Central limit theorem states that the distribution of means is approximately normal if the sample size is large enough. Inference (statistical) is the process of drawing conclusions about a population of observations from a sample of observations. Level of significance applies to the probability of incorrectly rejecting the null hypothesis in a test of hypothesis.
|
|
|
120. Which of the following statements best describes an intent-to-treat analysis?
A. A randomized patient who is later found to be ineligible for the study may be disregarded at analysis. B. Patients are included in the analysis of the study arm to which they were randomized. C. Patients who withdraw from the study before completion should be analyzed separately. D. Patients who are noncompliant with treatment should be dropped from analysis. |
Correct answer is B. RATIONALE: Omitting patients who withdraw without completing the study is a serious source of bias, as is dropping patients for noncompliance with treatment protocols. These may be patients for whom the treatment does not work or for whom the treatment has serious adverse consequences. There is no sound way to identify and eliminate this bias in the context of the trial, so the intention-to-treat analysis includes all consenting, randomized patients in the study arm to which they were randomized.
|
|
|
In a linear regression model, what is the meaning of R2?
A. It is the mean square error. B. It is the square of the significance level. C. It is the percent of variance explained by the model. D. It is a measure of the degree to which the data are skewed. |
Correct answer is C. RATIONALE: R2, the square of the correlation, can be shown to be the variance explained by the regression model divided by the total variance. That is, it is the percent of variance explained by the model.
|
|
|
Which of the following terms applies to the proportion of time that a diagnostic test is negative in patients who do not have the disease?
A. Sensitivity B. Specificity C. Standard error D. Subjective probability |
Correct answer is B. RATIONALE: Specificity reflects the proportion of time that a diagnostic test is negative in patients who do not have the disease.
|
|
|
A Kaplan-Meier survival curve yields a 1-year survival probability of 0.45 and an associated standard error of 0.07. The 95% confidence interval for the 1-year survival probability is approximately:
A. 0.40 to 0.50. B. 0.38 to 0.52. C. 0.31 to 0.59. D. 0.29 to 0.61. |
Correct answer is C. RATIONALE: The 95% confidence bounds are computed as the value of interest (approximately +2X the standard error). In this case, the 95% confidence interval is computed as follows: 0.45 +2(0.07), which equals approximately 0.31 to 0.59.
|
|
|
Which of the following terms applies to a clinical trial in which each group of subjects receives two or more treatments but in different sequences?
A. Cross-over study B. Cross-sectional study C. Cross-validation procedure D. Cross-product ratio |
Correct answer is A. RATIONALE: A cross-over study is applied to a clinical trial in which each group of subjects receives two or more treatments, but in different sequences. A cross-sectional study is an observational study that examines a characteristic in a set of subjects at one point in time. A cross-validation is a procedure applying the results of an analysis from one sample of subjects to a new sample of subjects to evaluate how well they generalize. A cross-product ratio is similar to relative risk.
|
|
|
A clinical trial must have which of the following characteristics?
A. A control group B. A prospective plan that involves human subjects C. A predetermined, fixed sample size D. Treating physicians or patients blinded to treatment received |
Correct answer is B. RATIONALE: Some clinical trials have only a single arm, with data from an already completed study as the (historical) control. The control arm, if there is one, may receive no treatment, a sham treatment, or an alternative, active treatment. Sample size may be altered during the course of a trial of any phase based on outcomes observed during the trial. Blinding can help to reduce treatment-related bias, but it is not essential.
|
|
|
Assuming that total white blood cell (WBC) counts follow a normal distribution, what would be the range of WBC counts for 50% of the individuals if the mean total WBC count is 7600 cells/mm3 with a standard deviation of 1400 cells/mm3?
A. Between 6200 and 9000 B. Between 7400 and 7800 C. <6200 and >9000 D. <7600 |
Correct answer is D. RATIONALE: Since the WBC counts follow a normal distribution, 50% of the population would be at or below the mean.
|
|
|
Which of the following tests should be used in the analysis of a nominal independent variable with a nominal dependent variable?
A. Chi-square B. One-way ANOVA C. Regression D. t test |
Correct answer is A. RATIONALE: For questions involving two variables (independent/dependent), the appropriate method is as follows: Chi-square: nominal/nominal. One-way ANOVA: nominal (more than two values)/numerical. Regression: numerical/numerical. t test: nominal (binary)/numerical. Actuarial: nominal/numerical (censored).
|
|
|
Correct answer is A. RATIONALE: For questions involving two variables (independent/dependent), the appropriate method is as follows: Chi-square: nominal/nominal. One-way ANOVA: nominal (more than two values)/numerical. Regression: numerical/numerical. t test: nominal (binary)/numerical. Actuarial: nominal/numerical (censored).
|
Correct answer is A. RATIONALE: The number of degrees of freedom is the number of groups minus 1.
|
|
|
Which of the following tests describes a regression method used when the outcome is censored and the regression coefficients are interpreted as adjusted relative risk or odds ratios?
A. Log-linear B. ANCOVA C. Mantel-Haenszel D. Cox proportional hazards model |
Correct answer is D. RATIONALE: Cox proportional hazards model is a regression method used when the outcome is censored. The regression coefficients are interpreted as adjusted relative risk or odds ratio. Log-linear analyzes the relationships among three or more nominal variables (not censored) and may be used as a regression method to predict a nominal outcome from nominal independent variables. ANCOVA (analysis of covariance) is a special type of analysis of variance or regression used to control for effect of a possible confounding factor. Mantel-Haenszel test is a statistical test of two or more 2 x 2 tables used to compare survival distributions or to control for confounding factors.
|
|
|
Which of the following is a regression method used for modeling survival times?
A. Fisher's exact test B. Bayesian inference C. Analysis of variance (ANOVA) D. Cox proportional hazards |
Correct answer is D. RATIONALE: The Cox proportional hazards model is a regression
method for modeling survival times. It is also called the proportional hazards model because it estimates the ratio of the risks. |
|
|
What is the endpoint of a phase I clinical trial?
A. Survival rates B. Tumor response rate to treatment C. Indication for treatment D. Treatment toxicity rates |
Correct answer is D. RATIONALE: Phase I trials provide information about the maximumtolerated
dose(s) of treatment. These trials provide little or no information about anti-tumor activity. |
|
|
Which of the following defines the probability that the observed data occurred by
chance? A. P value B. Chi square C. Odds ratio D. T-test |
Correct answer is A. RATIONALE: The P value gives the probability that the null hypothesis is
correct. Technically, it is the probability that the observed data or more extreme outcome would have occurred by chance. |
|
|
The probability that a test will produce a significant difference at a given significance
level is called the: A. risk ratio. B. statistical power. C. negative predictive value. D. omnibus test. |
Correct answer is B. RATIONALE: The probability that a test will produce a significant
difference at a given significance level is called the statistical power of a test (1 minus the probability of a type II error). |
|
|
The primary purpose of a phase II clinical trial of an experimental drug is to:
A. estimate the patient response rate to the drug with a 95% confidence interval. B. determine the largest dose of the drug that can be administered safely to a patient. C. determine if there is sufficient evidence of the drug’s safety and efficacy to justify further testing. D. compare the experimental drug therapy to the historical control group’s current standard of care. |
Correct answer is C. RATIONALE: Phase II trials are performed to determine whether there is
sufficient preliminary evidence for the safety and efficacy of a treatment to justify further testing. The appropriate dose has been established in earlier trials, usually in a phase I trial. Response is not always the desired outcome and may be poorly defined in some disease settings. Direct comparison of two therapies is based on some evidence of efficacy for each one, and it is generally the province of phase III trials. |
|
|
Which of the following study designs would be most appropriate for investigating the
effectiveness of a radiation dose of 70 Gy versus 60 Gy in providing local disease control for patients with prostate cancer? A. Cox proportional hazard ratio B. Receiver operator characteristic curve C. One-tailed test D. Two-tailed test |
Correct answer is D. RATIONALE: In designing a study, it is tempting to think that a new
intervention can be only beneficial and cause no harm. Such a study would focus on the positive impact only and is a one-tailed study design. The benefits include a smaller required sample size and increased study efficiency. A two-tailed design, though, analyzes whether the intervention increases the benefits (ie, local control) as well as increases the costs (ie, side effects). While it is more time-consuming, its results may be more well-respected. A Cox proportional hazard ratio is a method analyzing multiple collected pieces of data to see which are significant and which are not. A receiver operator characteristic curve is a plot of the truepositive rate against the false-positive rate of a studied condition. Neither the Cox proportional hazard ratio nor the receiver operator characteristic curve would be the optimal first selection for this study. REFERENCE. Moye L, et al. Circulation. 2002;105:3062-3065. |
|
|
Which of the following characteristics of historical control patients is most accurate?
A. They have known outcomes independent of the study. B. They receive the same treatment as in the experimental group. C. They are selected at random from healthy volunteers. D. Their standard-of-care treatment is no longer current. |
Correct answer is A. RATIONALE: A historical control is one whose outcomes are known
before patients receive the experimental treatment that is the subject of the trial. The historical control patients are not only treated before the patients receiving the experimental protocol, but their outcomes are known. This knowledge may affect the design and/or conduct of the experimental part of the trial. The therapy received by a historical control is necessarily earlier in time but may not be considered outdated. Registries and special purpose databases are often used to identify historical control patients, but historical control data also may be collected from among recently treated patients at a hospital or clinic. |
|
|
A clinical trial is conducted to investigate a drug’s effect on bone loss in elderly patients.
X-rays from middle-aged and elderly participants in the study will be distributed to one of two radiologists to be interpreted. Which of the following factors is most important to consider in ensuring the validity of the x-ray results? A. Images from an equal number of middle-aged and elderly patients should be interpreted by each of the two radiologists. B. The patients’ x-rays should be distributed randomly to each radiologist for interpretation. C. Both radiologists should read the same number of images. D. Both radiologists should read the images concurrently. |
Correct answer is A. RATIONALE: Each image will be read only once, so any systematic
differences between readings by the two radiologists will be difficult to separate from other effects on bone loss. By itself, this is acceptable if the differences can be shown to be small and/or controlled by use of a standard protocol for feature identification and data recording. Age is known to be related to bone loss, however, so it is important that the age distributions of the patients whose images are read by each radiologist are approximately the same. If not, any bias due to the reader will become confounded with age, making the study results difficult to interpret. If age is related to the time of day at which patients are available to participate in the study (e.g., middle-aged working participants during evenings and on weekends, elderly or retired participants during the day), the effect may be strong enough to rob the study of usefulness. Confounding can be controlled to some extent by design; that is, by making sure that the age profiles are similar for both radiologists. Randomizing the order in which images are read also does not reduce reader bias. Having each radiologist read half of the images ensures that the characteristics of reading by each radiologist will be equally represented, but it does not reduce the bias due to the reader. Timely data collection tends to improve data quality, and it is a good goal for the study, but it does not reduce bias or confounding. |
|
|
What is the positive predictive value of PET imaging for 100 patients who have the
following results? True positives: 36 True negatives: 18 False positives: 34 False negatives: 12 A. 51% B. 60% C. 67% D. 74% |
Correct answer is A. RATIONALE: The positive predictive value is a measure of number of
true positives/(number of true positives+ number of false positives). In this case: 36/(36+34)=51%. |
|
|
What is the negative predictive value of PET imaging for 100 patients who have the
following results? True positives: 36 True negatives: 18 False positives: 34 False negatives: 12 A. 74% B. 67% C. 60% D. 51% |
Correct answer is C. RATIONALE: The negative predictive value is defined as the number of
true negatives/(number of true negatives + number of false negatives). In this case, 18/(18+12)= 60%. |
|
|
A Type II error is defined as the probability that the:
A. null hypothesis is true. B. alternative hypothesis to the null hypothesis is false. C. null hypothesis is accepted when the alternative hypothesis is true. D. alternative hypothesis is accepted when the null hypothesis is true. |
Correct answer is C. RATIONALE: This is the definition of a Type II error.
|
|
|
Sensitivity can be defined as the probability of:
A. correctly classifying a person with a disease. B. correctly classifying a person without a disease. C. falsely classifying a person with a disease. D. falsely classifying a person without a disease. |
Correct answer is A. RATIONALE: This is the definition of sensitivity.
|
|
|
A test is performed to determine the presence of a malignancy, and its results are
compared with the actual incidence of the disease. What is the specificity of the test based on the findings shown below? Positive Test (105 patients) Negative Test (475 patients) Presence of malignancy 56 14 Absence of malignancy 49 461 A. 53.3% B. 80.0% C. 90.4% D. 97.1% |
Correct answer is C. RATIONALE: The specificity of a test is defined as the percentage of
individuals without a disease who are correctly classified as not having the disease. In this case, there were 49 + 461 = 510 subjects without the lesion. Of these subjects, 461 were correctly predicted. Thus, the specificity is 100 x 461/510 = 90.4%. |
|
|
What is the 95% confidence interval for a specificity of 0.6 if the standard error is 0.08?
A. 0.40 to 0.80 B. 0.44 to 0.76 C. 0.48 to 0.72 D. 0.52 to 0.68 |
Correct answer is B. RATIONALE: The correct answer is B since 95% confidence bounds are
computed as the value of interest +2 times the standard error. |
|
|
Which of the following statements about interpreting study results reported with
confidence intervals is true? A. An observed result has to be within the parameters of the interval to reject the null hypothesis. B. If the intervals of the studied parameters overlap, the results are more likely to be significant. C. The smaller the interval, the more reliable are the results. D. The width of the interval is not impacted by sample size. |
Correct answer is C. RATIONALE: Confidence intervals are used to assess the reliability of an
estimate. If an observed result falls outside of the interval, then the null hypothesis can be rejected. The size of the interval bars is directly impacted by the number of subjects in the sample size, i.e., the larger the number, the shorter the interval. The smaller the interval, the more dependable are the results. Non-overlapping confidence intervals on a graph indicate a true difference between study groups and, thus, more significant results. REFERENCE: http://en.wikipedia.org/wiki/Confidence_interval |
|
|
Which study design is used to compare the results of patients taking a new treatment
versus those taking the standard treatment? A. Phase I B. Phase II C. Phase III D. Phase IV |
Correct answer is C. RATIONALE: A Phase I trial is used to determine the best way to give a
new treatment and the best dose. A Phase II study tests whether a new treatment has an anticancer effect and if it works against a certain cancer. A Phase IV study is used when a treatment has been approved and is marketed, but it evaluates side effects not apparent in a Phase III trial. |
|
|
The sensitivity of a screening test is used to detect the presence or absence of disease
in the percentage of subjects: A. with disease who are classified as having disease. B. with disease who are classified as not having disease. C. without disease who are classified as having disease. D. without disease who are classified as not having disease. |
Correct answer is A. RATIONALE: Screening refers to the application of a test to people who
as yet have no symptoms of a particular disease. It is classified as having a positive (disease likely) or negative (disease unlikely) finding. Diagnostic tests tell whether or not a subject actually has the disease. The performance of a screening test is considered by the sensitivity and specificity. The sensitivity is the percentage of subjects with disease who are classified as having disease and the specificity is the percentage of subjects without disease who are classified as not having disease. Those subjects with the disease should all be classified as having disease, and those subjects without the disease should be classified as not having disease. Therefore, a highly sensitive and specific test is preferred. |
|
|
Which method best describes a retrospective study designed to correlate vitamin B6
dietary intake with the development of lung cancer based on the health histories of patients with and without the disease? A. Cohort study B. Case-control study C. Hazard ratio analysis D. Relative risk ratio |
Correct answer is B. RATIONALE: Retrospective case-control studies are studies in which a
group with a disease (case arm) is matched with a group without the disease (control arm) to examine if potential risk factors can be associated with subsequent disease development in the case arm. In contrast, retrospective cohort studies investigate two similar groups of patients who differ by a certain characteristic and compare the subsequent disease development between the two groups. Case-control studies begin with patients who have a disease to look for risk factors for disease development, whereas cohort studies begin with patients with suspected risk factors and assess if the factors are linked with disease development. A hazard ratio is performed to ascertain the effect of a certain variable on the risk (or "hazard") of an event occurring. It is commonly employed in drug studies to determine to what degree a drug can impact a disease outcome. (i.e., to what extent tamoxifen impacts disease-free survival compared to a placebo). A relative risk ratio describes the probability of an event occurring in an exposed group to an unexposed group (i.e., the probability of a person with adequate vitamin B6 levels developing lung cancer compared to those with inadequate dietary consumption of vitamin B6). While both a hazard ratio and a relative risk ratio can be performed as part of a cohort or case-control study, both of these represent statistical methods of data analysis rather than a type of study design. REFERENCES: McNutt L, et al. Estimating the relative risk in cohort studies and clinical trials of common outcomes. American Journal of Epidemiology (Am J Epidemiol). 2003;157:940-943. Spruance S, et al. Hazard ratio in clinical trials: antimicrobial agents and chemotherapy. 2004 Aug;48(8):2787-2792. Sistrom, et al. Proportions, odds, and risk. Radiology. 2004;230:12-19. National Cancer Institute, Dictionary of Cancer Terms, http://www.cancer.gov/dictionary. |
|
|
The square root of the variance equals the:
A. risk ratio. B. error coefficient. C. standard deviation. D. degrees of freedom. |
Correct answer is C. RATIONALE: The square root of the variance equals the standard
deviation and is a measure of the spread of a set of data. |
|
|
Which statistical technique is used when recent trial outcomes of partial breast
irradiation are compared to previously published outcomes of whole-breast irradiation? A. Cohort analysis B. Univariate analysis C. Historical control D. Case control |
Correct answer is C. RATIONALE: Using historically published data as a comparison to the
results of more recently published results is an example of a historical control. The control group is represented by patients who were treated in the past in comparison to patients who were treated more recently. Cohort analysis seeks to follow prospectively a group of patients who share common characteristics over a length of time. Univariate analysis seeks to determine the effect of one variable on an outcome (ex – age at diagnosis and local control). Case control studies are retrospective analyses in which patients with a certain diagnosis (controls) are compared against similar patients without the diagnosis to assess for differences between the two groups. |
|
|
Which statistical term has a high value when the variation in repeated measurements is
poor? A. Standard deviation B. Number of subjects C. Mean D. Median |
Correct answer is A. RATIONALE: Standard deviation measures variability of data. For poor
repeatability, there is considerable variation in repeated measurements. |
|
|
A receiver operating characteristic curve (ROC) evaluates the performance of a
diagnostic test by graphing: A. the sensitivity against the specificity. B. the true-positive rate against the false-positive rate. C. the true-negative rate against the false-negative rate. D. 1 minus the sensitivity against the specificity. |
Correct answer is B. RATIONALE: This is the definition of an ROC curve. Note that an
equivalent definition is that the ROC curve graphs the sensitivity against 1 minus the specificity. |
|
|
Which method of analysis would best determine the simultaneous effect of smoking and
age on the risk of lung cancer? A. Multivariate B. Kaplan-Meier C. Cox proportional hazards D. t-test |
Correct answer is A. RATIONALE: A multivariate analysis is used when the effect of more than
one variable needs to be considered when predicting an outcome. |
|
|
Specificity can be defined as the probability of:
A. correctly classifying a person with a disease. B. falsely classifying a person with a disease. C. correctly classifying a person without a disease. D. falsely classifying a person without a disease. |
Correct answer is C. RATIONALE: Specificity is the probability that a test will be negative for
patients who do not have a disease or that persons without a disease will be correctly identified. |
|
|
What is the appropriate statistical method to measure the degree of reliability between
different and independent raters? A. Chi-square test B. McNemar's test C. kappa coefficient D. one-way analysis of variance |
Correct answer is C. RATIONALE: The Kappa coefficient is a widely used statistic for
measuring the degree of reliability between different and independent raters. It compares the agreement against that which might be expected by chance. The Kappa coefficient ranges from 1 (perfect agreement) to 1 (complete disagreement). Here is one possible interpretation of Kappa. Poor agreement = Less than 0.20. Fair agreement = 0.20 to 0.40. Moderate agreement = 0.40 to 0.60. Good agreement = 0.60 to 0.80. Very good agreement = 0.80 to 1.00. |
|
|
What is the 95% confidence interval if the true-positive rate of a diagnostic test is 0.8
and the standard error is 0.04? A. 0.68 to 0.92 B. 0.70 to 0.80 C. 0.72 to 0.88 D. 0.74 to 0.86 |
Correct answer is C. RATIONALE: Approximate 95% confidence bounds are computed as the
value of interest +2 times the standard error. |
|
|
Which statistical method is most appropriate to calculate time to recurrence of cancer in
two groups of patients after adjusting for age and sex? A. Logrank test B. Generalized Wilcoxon test C. Cox proportional hazards regression D. Logistic regression |
Correct answer is C. RATIONALE: Cox regression analysis is designed to deal with settings in
which the outcome measure is dichotomous and time dependent. |
|
|
What is the specificity of the x-ray interpretation compared to the pathology results
shown below? Abnormal x-ray and abnormal pathology 300 patients Abnormal x-ray and normal pathology 30 patients Normal x-ray and abnormal pathology 20 patients Normal x-ray and normal pathology 50 patients A. 93.8% B. 90.9% C. 71.4% D. 62.5% |
Correct answer is D. RATIONALE: The sensitivity and specificity are also used in investigating
the performance of simpler diagnostic tests. Suppose "gold standard" tests provide whether or not a subject actually has the disease. The number of subjects without disease based on the "gold standard" diagnosis is 30+50. Among those, 50 subjects are classified as not having disease by x-ray examination: Specificity = 50/(50+30) = 62.5%. |
|
|
Which statistical measure requires survival models to be calculated?
A. Specificity B. Sensitivity C. Odds ratio D. Hazard ratio |
Correct answer is D. RATIONALE: Logistic regression models yield estimates of odds ratios,
sensitivity, and specificity. Survival models are required if hazard ratios are to be produced. |
|
|
A randomized trial is conducted to compare survival in patients who have NSCLC and receive standard treatment plus a placebo versus standard treatment plus a new chemotherapy drug. Which statistical procedure should be used to compare survival in the two groups after adjusting for the age of the subject and the stage of the disease?
A. Logistic regression analysis B. Cox regression analysis C. Fisher's exact test D. Log rank test |
Correct Answer is B. RATIONALE: Cox regression analysis can be used to compare survival curves after adjusting for covariates. The other statistical methods are used in different circumstances.
|
|
|
Which of the following statements about actuarial survival analysis is true?
A. Censored subjects are those who have had the event being studied. B. It cannot be used to compare two survival curves if enrollment in the study is staggered. C. It can only be used to analyze mortality data. D. It incorporates time on study data until a subject is lost to follow-up. |
Correct Answer is D. RATIONALE: A primary benefit of survival analysis is that it incorporates time on study data until a subject is lost to follow-up, has the event being studied, or the study ends.
|
|
|
The specificity of a screening test used to detect the presence or absence of a disease indicates the percentage of subjects:
A. without the disease who are classified as not having the disease. B. without the disease who are classified as having the disease. C. with the disease who are classified as having the disease. D. with the disease who are classified as not having the disease. |
Correct Answer is A. RATIONALE: Screening refers to the application of a test to people who as yet have no symptoms of a particular disease. It is classified as having a positive (disease likely) or negative (disease unlikely) finding. Diagnostic tests tell whether or not a subject actually has the disease. The performance of a screening test is considered by the sensitivity and specificity. The sensitivity is the percentage of subjects with disease who are classified as having disease, and the specificity is the percentage of subjects without disease who are classified as not having disease. Those subjects with the disease should all be classified as having disease, and those subjects without the disease should be classified as not having disease. Therefore, a highly sensitive and specific test is preferred.
|
|
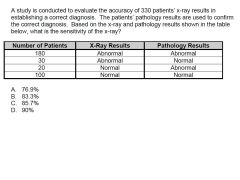
A study is conducted to evaluate the accuracy of 330 patients’ x-ray results in establishing a correct diagnosis. The patients’ pathology results are used to confirm the correct diagnosis. Based on the x-ray and pathology results shown in the table below, what is the sensitivity of the x-ray?
A. 76.9% B. 83.3% C. 85.7% D. 90% |
Correct Answer is D. RATIONALE: The sensitivity and specificity are also used in investigating the performance of simpler diagnostic tests. Suppose "gold standard" tests provide whether or not a patient actually has the disease. Based on the abnormal pathological results, the number of patients who have the disease is 180 + 20 (200 of the 330 patients). Of these 200 patients, 180 patients were classified as having the disease based on the x-ray results: Thus, the specificity of the x-ray is 180/(180 + 20) = 90%.
|
|
|
Which statistical procedure is most commonly used to estimate the effect of a given variable on survival while accounting for the effect of other variables?
A. Student's t-test B. Cox proportional hazards model C. Chi-square goodness of fit test D. Analysis of variance (ANOVA) |
Correct Answer is B. RATIONALE: Cox proportional hazards model is a multivariate survival method of assessing several predictor variables on a categorical outcome when the outcome is censored. Student's t-test is used to test the null hypothesis that two independent or unrelated groups have the same mean. Chi-square goodness of fit tests a null hypothesis that the frequency distribution of certain events observed in a distribution of certain events observed in a sample is consistent with a particular theoretical distribution. Analysis of variance (ANOVA) is a statistical procedure that determines whether any differences exist among two or more groups of subjects on one or more factors.
|
|
|
Which statistical procedure is commonly used to determine if there is a difference between the survival times of different groups?
A. Log rank test B. Cox proportional hazards model C. Recursive partitioning analysis D. Multivariate analysis of variance (MANOVA) |
Correct Answer is A. RATIONALE: The log rank test is a univariate analysis used to compare the survival distributions of two samples. Cox proportional hazards is a multivariate survival method of assessing several predictor variables on a categorical outcome when the outcome is censored. MANOVA is a multivariate analysis of variance. Recursive partitioning analysis is a multivariate analysis that creates a decision tree to classify members of a population based on unrelated dependent variables.
|
|
|
Which of the following problems is demonstrated when there is considerable variation in repeated measurements of the same subjects using the same study methods under the same lab conditions?
A. Poor repeatability B. Lack of agreement C. Low reproducibility D. Selection bias |
Both options A and C were scored correct. RATIONALE: The method has poor repeatability if there is considerable variation in repeated measurements on the same subject. Lack of agreement is used to compare the agreement between two methods. Reproducibility is the variability introduced into the measurement system by the bias differences of different methods. Selection bias is a bias introduced by the nonrandom process of selecting the patients in the study. This affects the generalizability (external validity) of a study but not its (internal) validity.
|
|
|
A study is designed to determine if treatment decreases total serum cholesterol levels. Participants in the study have a mean total serum cholesterol level of 250 mg/dL at baseline, which decreases to 180 mg/dL after 6 months of treatment. Which type of test and null hypothesis (H0) findings best describe this analysis?
A. Two-tailed test, (H0) = total serum cholesterol level not decreased by treatment B. Two-tailed test, (H0) = total serum cholesterol level decreased by treatment C. One-tailed test, (H0) = total serum cholesterol level not decreased by treatment D. One-tailed test, (H0) = total serum cholesterol level decreased by treatment |
Correct Answer is C. RATIONALE: The null hypothesis H0: d = 0; the alternative hypothesis H1: d < 0, where d denotes the total cholesterol level difference between the baseline and end of study. This is a left-tailed test since it emphasizes the "decrease" instead of any difference.
|
|
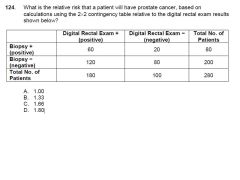
What is the relative risk that a patient will have prostate cancer, based on calculations using the 22 contingency table relative to the digital rectal exam results shown below?
|
Correct Answer is C. RATIONALE: The positive predictive value would be 60/180 for a digital rectal exam (DRE). The negative predictive value would be 80/100. In the DRE application, the relative risk gives the rate of cancer among 'yes' predictions in ratio to the rate of cancer among 'no' predictions. Relative risk = 60(20+80)/20(60 +120) = 1.66. REFERENCE: Statistics in Medicine, 2nd ed, Chapter 15, pp 241–279.
|
|
|
How many patients would need to receive chemoprevention treatment to keep one person from getting cancer if the absolute risk reduction is 0.01?
A. 0001 B. 0010 C. 0100 D. 1,000 |
Correct Answer is C. RATIONALE: The number needed for chemoprevention treatment to prevent one event is the reciprocal of absolute risk reduction or 1/ARR. In this example, 1/0.01 = 100. This type of information helps clinicians evaluate the relative risks and benefits of a particular treatment. REFERENCE: Basic and Clinical Biostatistics, 4th ed, Chapter 3, page 52.
|
|
|
Which statistical quantity decreases as the number of measurements increases?
A. Standard error of the mean B. Standard deviation C. Variance D. Mean |
Correct Answer is A. RATIONALE: The standard error of the mean is the standard deviation of the distribution divided by the square root of the number of measurements. Thus, as the number of measurements increases, the uncertainty in the mean value of the distribution decreases.
|
|
|
The "power" of a test refers to the:
A. confidence level selected to compare two datasets. B. precision to which the mean of a distribution can be known. C. accuracy to which the true mean of a distribution can be known. D. probability of rejecting the null hypothesis when it is false. |
Correct Answer is D. RATIONALE: The power of a test is the probability of detecting a difference that exists. It can be stated as the probability of rejecting the null hypothesis when it is indeed false or concluding that the alternative hypothesis is true when it really is true. It is intimately related to the sample size used in the study. REFERENCE: Dawson B and Trapp RG. Basic and Clinical Biostatistics. 4th ed. 2004. pp 109 and 411.
|
|
|
Which trial design evaluates how much of a chemotherapy drug should be given and how effective it is at a prescribed dose?
A. Phase 0 B. Phase I C. Phase II D. Phase III |
Correct Answer is C. RATIONALE: Phase 0: This trial phase is used to gather preliminary data on what a drug does to the human body and what the body does to the drug. Phase I: This trial phase is designed to assess safety, tolerability, pharmacodynamics, and pharmacokinetics. Phase II: This trial phase is designed to assess how much drug should be given as well as has how it works at a prescribed dose. Phase III: During this phase, the drug or treatment is given to large groups of people to confirm its effectiveness, monitor side effects, compare it to commonly used treatments, and collect information that will allow the drug or treatment to be used safely.
|
|
|
Which type of study evaluates two groups of patients with prostate cancer previously treated with the same dose of radiation (one group with rectal bleeding, one group without rectal bleeding) to determine if IMRT can reduce rectal toxicity in comparison to 3D conformal therapy?
A. Cohort study B. Case-control study C. Randomized control trial D. Crossover study |
Correct Answer is B. RATIONALE: A case-control study is an observational study that begins with patients who have the outcome (rectal toxicity in this case) or disease being investigated and control subjects who do not have the outcome or disease. It then looks backward to identify possible precursors or risk factors. REFERENCE: Dawson B and Trapp RG. Basic and Clinical Biostatistics. 4th ed. 2004. pp 333 and 404.
|
|
|
What is the range of values for 67% of a population given a mean value of 0.65, a standard deviation of 0.06, and assuming a normal distribution?
A. 0.625 to 0.675 B. 0.59 to 0.71 C. 0.53 to 0.77 D. 0.47 to 0.83 |
Correct Answer is B. RATIONALE: For a normal distribution, 67% of values fall within 1 standard deviation, 95% of values fall within 2 standard deviations, and 99% of values fall within 3 standard deviations.
|