![]()
![]()
![]()
Use LEFT and RIGHT arrow keys to navigate between flashcards;
Use UP and DOWN arrow keys to flip the card;
H to show hint;
A reads text to speech;
17 Cards in this Set
- Front
- Back
|
Data in which a single variable is measured. |
Univariate Data |
|
|
Data in which two variables are measured. |
Bivariate Data |
|
|
The variable whose value can be explained by the value of the explanatory variable or predictor variable. |
Response Variable |
|
|
A graph that shows the relationship between two quantitative variables measured on the same individual. Each individual in the data set is represented by a point in the scatter diagram. The explanatory variable is plotted on the horizontal axis and the response variable is plotted on the vertical axis. |
Scatter Diagram |
|
|
Two variables that are linearly related have this type of association when above-average values of one variable are associated with above-average values of the other variable and below-average values of one variable are associated with below-average values of the other variable. That is, whenever the value of one variable increases the value of the other variable also increases. |
Positively Associated |
|
|
Two variables that are linearly related have this type of association when above-average values of one variable are associated with below-average values of the other variable. That is, whenever the value of one variable increases the value of the other variable decreases. |
Negatively Associated |
|
|
A measure of the strength and direction of the linear relation between two quantitative variables. |
Linear Correlation Coefficient or Pearson product moment correlation coefficient. The Greek letter ρ (rho) represents the population correlation coefficient, and r represents the sample correlation coefficient. |
|
|
Formula for Linear Correlation Coefficient |
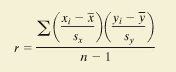
Where: x̄ is the sample mean of the explanatory variable.
Sx is the sample standard deviation of the explanatory variable.
Ybar is the sample mean of the response variable.
Sy is the sample standard deviation of the response variable.
n is the number f individuals in the sample. |
|
|
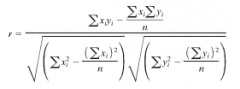
Computational Formula for Linear Correlation Coefficient |
|
|
|
Formula for Slope |
m=(y2-y1)/(x2-x1) |
|
|
The point where the graph of the line crosses the y-axis |
Y intercept |
|
|
Point Slope Formula |
y-y1=m(x-x1) |
|
|
Straight Line Equation |
y = mx + b
Where m is the slope and b is the y-intercept |
|
|
The difference between the observed and predicted values of y. |
The error or Residual. |
|
|
The line that minimizes the sum of the squared errors (or residuals). This line minimizes the sum of the squared vertical distance between the observed values of y and those predicted by the line, ŷ (y hat). We represent this as "Minimize Σ residuals²". |
Least-Squares Regression Line |
|
|
Equation for Least Squares Regression Line |
ŷ = b1x + b0
Where b1 = r(sy/sx) is the slope of hte least-squares regression line
and
b0 = y-bar - b1x̄ is the y-intercept of the least squares regression line. |
|
|
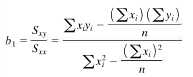
Computational Formula for Least Squares Regression Line |
|