![]()
![]()
![]()
Use LEFT and RIGHT arrow keys to navigate between flashcards;
Use UP and DOWN arrow keys to flip the card;
H to show hint;
A reads text to speech;
25 Cards in this Set
- Front
- Back
- 3rd side (hint)
|
This is computed by adding all the values of the variable in the data set and dividing by the number of observations. |
Arithmetic Mean
|
|
|
|
μ (mew). This is computed using all the individuals in a population. The population mean is a parameter. |
Population Arithmetic Mean
|
|
|
|
x̄ (X-bar). This is computed using the sample data. The sample mean is a statistic. |
Sample Arithmetic Mean
|
|
|
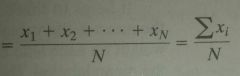
Formula for μ
|
The subscript i shows that the various values are distinct and does not serve asw a mathematical operation. For example, x1 is the first data value, x2 is the second, and so on. |
|
|
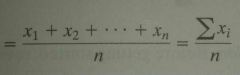
Formula for x̄
|
The subscript i shows that the various values are distinct and does not serve as a mathematical operation. For example, x1 is the first data value, x2 is the second, and so on. |
|
|
|
The value that lies in the middle of the data when arranged in ascending order.
|
The Median
|
|
|
|
A numerical summary of data is said to be this if extreme values (very large or small) relative to the data do not affect its value substantially. |
"Resistant"
|
|
|
|
This is the most frequent observation of the variable that occurs in the data set.
|
The Mode
|
|
|
|
This is the difference between the largest and the smallest data value.
|
Range (R)
|
|
|
|
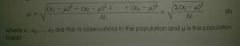
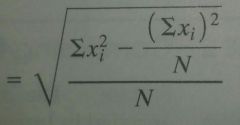
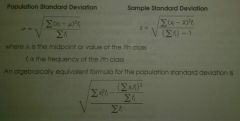
This is the square root of the sum of squared deviations about the population mean divided by the number of the observations in the population, N. That is, it is the square root of the mean of the squared deviations about he population mean.
|
The population standard deviation
|
|
|
The population standard deviation formula |
The populations standard deviation is symbolically represented by a σ (lowercase Greek sigma)
|
The average distance to the mean. |
|
|
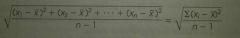
The computational formula for σ (population standard deviation)
|
|
|
|
Formula for s (Sample standard deviation)
|

|
|
|
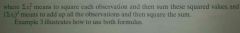
The square root of the sum of squared deviations about the sample mean divided by n-1, where n is the sample size
|
The sample standard deviation
|
|
|
|
The square of the standard deviation. ( σ2, s2 ) |
Variance |
|
|
|
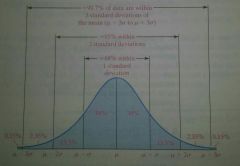
If a distribution is roughly bell shaped, then:
1. Approximately 68% of the data will lie within 1 standard deviation of the mean. 2. Approximately 95% of the data will lie within 2 standard deviations of the mean. 3. Approximately 99.7% of the data will lie within 3 standard deviations of the mean. |
The Empirical Rule
|
|
|
|
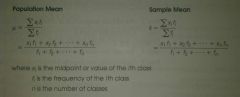
Formulas to approximate the mean of a viariable from a frequency distribution. |
|
|
|
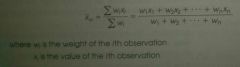
Formula for Weighted Mean
|
|
|
|
Formulas to approximate the standard deviation of a variable from a frequency distribution
|
|
|
|
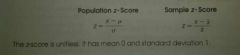
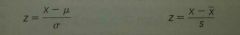
This represents the distance that a data value is from the mean in terms of the number of standard deviations. We find it by subtracting the mean from the data value and dividing the result by the standard deviation.
|
Z-Score
|
|
|
|
This is found by multiplying each value of the variable by its corresponding weight, adding these products, and dividing this sum by the sum of the weights.
|
Weighted Mean (x̄w) |
|
|
|
z-score formula
|
|
|
|
This, denoted as Pk, of a set of data is a value such that k percent of the observations are less than or equal to the value.
|
Kth Percentile
|
|
|
|
This divides data sets into fourths or four equal parts.
|
Quartile
|
|
|
|
This is the range of the middle 50% of the observations in a data set. That is, the difference between the third and first quartiles and is found using formula IQR=Q3-Q1
|
Interquartile Range - IQR
|
|