Reading...
![]()
Play button
![]()
Play button
![]()
Use LEFT and RIGHT arrow keys to navigate between flashcards;
Use UP and DOWN arrow keys to flip the card;
H to show hint;
A reads text to speech;
18 Cards in this Set
- Front
- Back
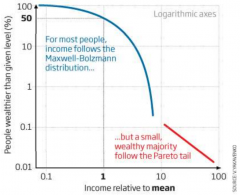
Pareto Tail
|
Result: the richest 10% are those that are most inclined to save.
=> Inequality can be reduced if we all start saving |
|
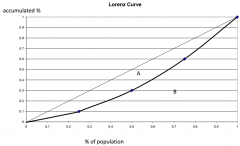
Lorenz Curve
|
shows the degree of equality in income distribution:
- closer the Lorenz curve is to the diagonal, the more equally income is distributed. |
|
|
Gini Coefficient
|
The Gini coefficient calculates the area between the
Lorenz curve and the 45 degree line. Gini coefficient = A/(A+B) Perfect equality Gini = 0 Imperfect equality Gini = 1 (one person has all income) |
|
|
Poverty rate:
|
Percentage of population whose family income falls below an absolute level called the poverty line.
|
|
|
Poverty Line
|
Absolute level of income set by the government for
each family size below which a family is deemed to be in poverty |
|
|
Relative poverty
|
If income < some % of median income)
Relative poverty is inevitable! (unless everyone is exactly equal!) |
|
|
Problems in measuring inequality
|
1. Expenditure-based vs. income-based measures
2. Economic life cycle. 3. Transitory vs. permanent income. 4. Economic mobility |
|
|
Pareto optimal
|
No-one can be made better off without at least one person being made worse off.
|
|
|
Pareto improving reform
|
Means at least some people are better off, and no one is worse off.
Note: dictatorship may be pareto optimal, but not desirable from a society’s point of view |
|
|
Utilitarianism
|
Social happiness is the sum of the individuals,
so maximize society’s total utility. Note: Utilitarian GOVT has to balance gains from greater equality against losses from distorted incentives. |
|
|
Diminishing marginal utility
|
First unit of consumption of a good or service yields more utility than the second or subsequent units.
….taking 1 $ from rich to the poor will decrease the rich's utility and increase the poor's, but rich's falls by less than poor's rises. Therefore, overall utility increases. |
|
|
Liberalism:
Max-min criterion: |
Choose rules from behind a ‘veil of ignorance’
Maximize the position of the poorest in society! |
|
|
Libertarianism
|
Political philosophy according to which govt should
punish crimes and enforce voluntary agreements but not redistribute income. Equality of opportunities is more important than equality of income! |
|
|
Policies to reduce poverty
|
1. Minimum wage laws
2. Social security 3. Negative income tax 4. In-kind transfers 5. Anti-poverty programs and work incentives |
|
|
Negative Income Tax
|
tax owed = (0.4 × income) - $15,000
e.g. - family that earns $70,000 pays $13,000 tax - family that earns $37,500 owes nothing - family that earns $30,000 owes -$3,000. |
|
|
Classic liberal / libertarians
|
Emphasising self-reliance, individualism and free markets with less regulation, tax and government services.
eg. US & UK: least healthy among wealthy democracies |
|
|
Modern liberal
|
Emphasise full employment, income protection, housing, education, health and social insurance.
eg. Sweede & Norway: enjoy better health |
|
|
“cut-throat” US versus “cuddly” Sweden:
There are trade-off's between: |
Economic growth/innovation and growing inequality/high poverty/a weak social safety net.
|