![]()
![]()
![]()
Use LEFT and RIGHT arrow keys to navigate between flashcards;
Use UP and DOWN arrow keys to flip the card;
H to show hint;
A reads text to speech;
56 Cards in this Set
- Front
- Back
|
Reward-to-risk |
=fund return/fund standard deviation |
|
|
Sharpe ratio |
(fund return -tbill rate)/fund standard deviation |
|
|
Gross profit margin ratio |
(net sales- cost of goods sold)/net sales |
|
|
Price to earnings ratio |
current price of common share/earnings per share |
|
|
Calculating return |
R=(Pi+Ci-Po)/Po
R=return Po=Original price Pi=sold price Ci= cash flow earned |
|
|
Time weighted return aka geometric mean return |
TWR=[(1+ri)(1+rii)]^1/2-1 for two years
or
TWR=[(1+ri)(1+rii)(1+riii)]^1/3-1 for 3 years |
|
|
Present value |
=future value / (1+i)^n
i=interest n=number of years |
|
|
value of common share |
Pc=$dividend/ic-g
Pc= value of common share $dividend=dividend expected to be paid at the end of the year ic= return required for risk g= growth rate of dividend |
|
|
valuing a bond or YTM |
Bo=C1/(1+i)^1+C2/(1+i)^2+C3/(1+i)^3+C4+par/(1+i)^4
Bo=current value of bond C1-C4= annual coupon payments (in dollars) Par= par or face value paid at maturity |
|
|
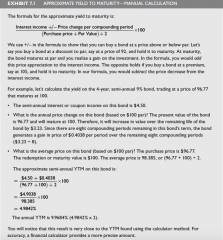
AYM approx yield to maturity |
AYM=(C+(par-Bo)/n)/((par+Bo)/2)
AYM= approx yield to maturity C=annual coupon payment in dollars Par=bonds par Bo=bond current market price n=number of years remaining to maturity |
|
|
Selection effect |
actual return- allocation return |
|
|
Net return on common equity |
net income / share holders' equity |
|
|
Operating profit margin ratio |
(net sales- cogs+selling,admin, gen. expenses)/net sales |
|
|
inventory turnover ratio |
Cogs/inventory |
|
|
current yield |
sevenday yield x (365/7) |
|
|
effective yield |
[(1+sevenday yield) 365/7-1] |
|
|
Debt/equity ratio |
short & long term debt/book value of shareholders' equity |
|
|
What is the return policy or allocation return |
portfolio return= Index return x portfolio weighting |
|
|
Interest coverage ratio |
earnings before interest & taxes/total interest charges |
|
|
current yield |
coupon payment / current market price |
|
|
quick ratio aka acid test |
(current assets- inventories)/current liabilities |
|
|
current ratio |
current assets/current liabilities |
|
|
Calculate inflation |
[(CPI current-CPI previous)/CPI previous]x100 |
|
|
earnings per common share EPS ratio |
(Net earnings - preferred shares)/number of common shares outstanding |
|
|
measuring portfolio risk |
Rp=Rf+Bp(Rm-Rf)
Rp=expected return on portfolio Rf=expected return from holding t-bills Bp=beta of portfolio Rm=expected return on the S&P/TSX Composite index |
|
|
NAVPU |
(market value of all assets- total liabilities)/number of units withstanding |
|
|
Inflation Rate |
[(CPIcurrent-CPI previous)/CPI previous] x 100 |
|
|
sevenday yield |
(ending net assets value/initial net asset value)-1 |
|
|
cashflow from operations/total debt ratio |
cash flow from operations/total debt |
|
|
pretax profit margin ratio |
net earnings before taxes/net sales |
|
|
valuing a preferred share |
V=($divn/(1+r)^n+same for each year
V=value $div=dvidend of the next period r=required rate of return n=number of year |
|
|
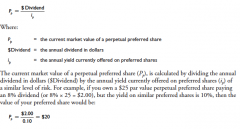
preferred perpetual shares' current market value |
Pp=$div/ip
Pp=current market value $div= dividend in dollars ip= annual yield curently offered on preferred shares of similar risk level |
|
|
GDP |
GDP=C+I+G+X-M
C=consumption of households on G&S I=investment by business on capital goods G= government spending(military, health etc) X=exports puchased by foreigners M= imports sold to us by foreigners |
|
|
GDP Expenditure Approach |
GDP = C + I + G + (X-M) C= Personal Consumption I = Investment G= Government Spending on goods and services X= Net Exports M= Imports |
|
|
GDP Income Approach |
Totalling= Wages of labour + Rent of Land + Interest for capital goods + Profits for entrepreneurs |
|
|
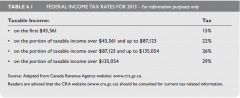
Calculating Income Tax Payable |
|
|
|
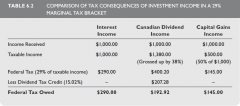
Tax Interest Income, Div and Capital Gain |
|
|
|
Contributions To an RRSP |
-18% of the previous year's earned income -The RRSP dollar limit fo the year ($23,820 in 2013) lesser of the above two amounts = (A) Contribution = (A) - PA - PSPA + Contribution Room PA= Pension Adjustment PSPA = Past Service Pension Adjustment |
|
|
Bond Yield |
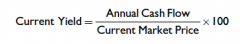
Current Yield |
|
|
YTM (Yield to Maturity) |
|
|
|
Perpetual Preferred Share |
|
|
|
Expected Return |
Expected Return = Cash Flow + Capital Gain (or -Capital Loss) |
|
|
Real Return |
Real Return = Nominal Rate- Annual Inflation Rate *same of computing Real GDP |
|
|
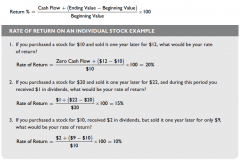
Rate of Return |
|
|
|
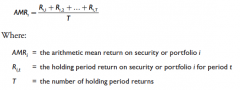
Arithmetic Mean (AMR) |
|
|
|
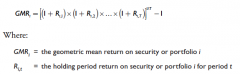
Geometric Mean (GMR) |
|
|
|
Rate of Return on a Portfolio |
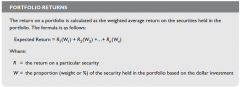
|
|
|
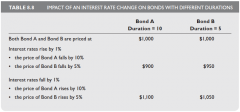
Interest rates on bonds with different duration |
|
|
|
Financial Statement Equation |
Assets = Liabilities +Equity |
|
|
Dividend Yield |
Dividend Yield = Annual Dividend per share/ Current market price |
|
|
P/E or Price Earning Ration |
Current Price of Common/ Earnings per share *Also Indicates Investor Confidence |
|
|
Trend Analysis |
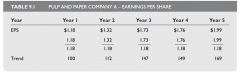
|
|
|
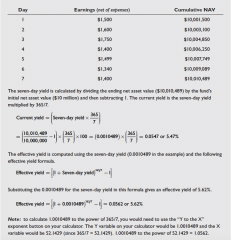
Seven-day Yield |
(Ending Net Asset Value/Initial Net Asset Value)-1 |
|
|
Effective Yield (money market funds) |
|
|
|
Sharpe Ratio |
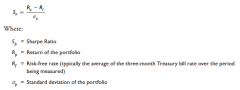
|
|
|
Offering or Purchase Price |
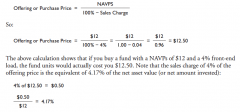
|