![]()
![]()
![]()
Use LEFT and RIGHT arrow keys to navigate between flashcards;
Use UP and DOWN arrow keys to flip the card;
H to show hint;
A reads text to speech;
58 Cards in this Set
- Front
- Back
- 3rd side (hint)
|
The population aged 85 years and over is the _________ growing age group gobally |
Fastest |
|
|
|
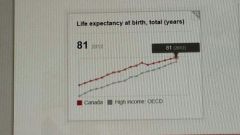
Life expectancy at birth |
Indicates the number of years a newborn infant would live if prevailing patterns of nartality at the time of its birth were to stay the same thought out it's life |
|
|
|
Life expectancy at birth, (Canada and High income) |
|
|
|
|
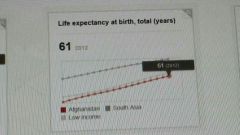
Life expectancy at birth, (Afghanistan, South Asia, Low Income) |
|
|
|
|
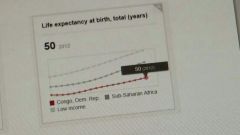
Life expectancy at birth, (Congo, Sub-Saharan Africa, Low Income) |
|
|
|
|
2013: life expectancy in developed countries Japan: males _________ and female _______ Australia: males _______ and females _______
|
Japan: males 80 and females 87 Australia: males 80 and females 84 |
|
|
|
2013: life expectancy in developing countries India: males _______ and females ______ Zambia: males ________ and females _______ |
India: males 65 and females 68 Zambia: males 56 and females 60 |
|
|
|
Woman aged 100+ years will become _________, especially in many developed countries |
Commonplace |
|
|
|
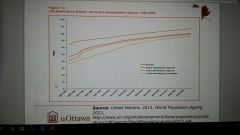
Life expectancy at birth: world and development regions (1950-2050) |
|
|
|
|
Countries with higher degrees of income inequality tend to have .... |
Poorer health outcomes |
|
|
|
Health of a population is better in many countries with ..... |
Less income disparity, and greater social equality/equity |
|
|
|
Cumulative Inequality Theory |
Unequal or disadvantaged status and the accumulation of risk early in life can contribute to unequal situations and hardships later in life |
|
|
|
Median age of the world is _______ |
28.4 yeas |
|
|
|
Median age in most developing countries is ______________ |
Below 25 years |
|
|
|
While _________ countries have a higher porpotion of older people within their populations, the majority of older people in the world (64%) live in _________ |
Developed countries Developing countries |
|
|
|
2012: ____ of the world's population (562 million individuals) was 65 yeas of age or older |
8% |
|
|
|
2012: In more developed regions _______ of the population is 65+ |
16.5% |
|
|
|
2012: In less developed regions ______ of the population is 65+ |
6.2% |
|
|
|
2050: _______ of the world's population (1.53 billion persons) expected to be aged 65 years and older |
16.7% |
|
|
|
2050: ________ people in developed regions and _______ people in developing regions will be aged 60 years and older |
1 in 3 1 in 5 |
|
|
|
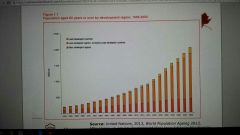
Population aged 60 years or over by development region, 1950-2050 |
|
|
|
|
The number of older persons is growing very fast, and the world is in the middle of a transition toward significantly _________ |
Older populations |
|
|
|
The gap in life expectancy at older ages is _________, as LDRS continue to experience large gains in survivorship |
Narrowing |
|
|
|
The gender gap in life expectancy is expected to narrow in _______,but to widen in ________ |
MDRs LDRs |
|
|
|
Nearly 80% of older persons will live in _________ in 2050 |
LDRs |
|
|
|
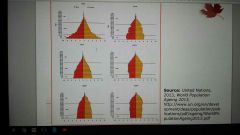
Population pyramids of the less and more developed regions: 1970, 2013 and 2050 |
|
|
|
|
2013: the Shar of older persons aged 80 years or over was ______ |
14% |
|
|
|
The share of persons aged 80 years or over is expected to reach ________ in 2050 |
19% |
|
|
|
The older population is predominantly __________ |
Female |
|
|
|
2013: ____ men for 100 woman in age group 60 years and over; and _______ men for 100 woman in age group 80 years and over |
60 years and over: 85 men per 100 women 80 years and over: 61 men per 100 women |
|
|
|
_____ of older persons aged 60 years or over live independently either alone or with their spouse |
40% |
|
|
|
Labour force participation 2010: For persons aged 65 years or over, it was around _______ in the LDRs and ______ in the MDR |
LRD: 31% MDR: 8% |
|
|
|
Social protection: _____ of people aged 60 years and older live with a disability, and ______ of the world's older population does not have a pension and relies on labour and family for income |
46% 80% |
|
|
|
Life expectancy at ages 60 and 80: world and development regions, 2010-2015, 2020-2025 and 2045-2050 |
|
|
|
|
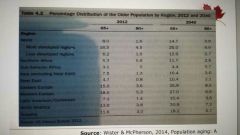
Percentage Distribution of the older population by region, 2012 and 2040 |
|
|
|
|
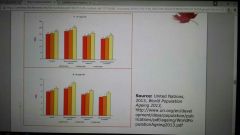
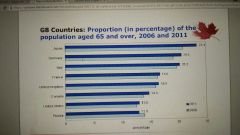
G8 countries: proportion of the population aged 65 and over,2006 and 2011 |
|
|
|
|
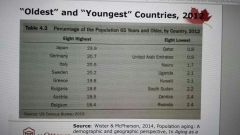
Oldest and youngest countries, 2012 |
|
|
|
|
Has the largest number of older adults (122 million in 2012, projected to increase to 327 million by 2040) |
China |
|
|
|
Has the highest percentage of people aged 65 yeas and older (20% of their popualtion); bu 2100 more than half of the Japanese population will be aged 60+ years |
Japan |
|
|
|
The only major region in the world which the population is still relatively young |
Sub-Saharan Africa |
|
|
|
Sub-Saharan Africa |
-Fertility and mortality rates remain high by global standards - women have 5.5 children on average (compared to 2m8 in North Africa, and 2.4 in Asia) -Life expectancy of the region is approximately 50 years (13 years below to average for all less developed countries) -Proportion of older adults in Africa is expected to increase only modestly in Africa, but the absolute number of older people will rise |
|
|
|
World fertility rates: 2010: 1950: |
2010: 2.5 births/women 1950: 5 births/women |
|
|
|
Global birth rates in 2012 |
19.15 births per 1 000 total population |
|
|
|
Global replacement fertility rates |
-ranges from 2.3 to 3.3 births/women in develop countries because of higher mortality rates -globally, the total fertility rate at replacement is 2.33 -fertility rates are below the replacement level in almost all OECD countries |
|
|
|
____ to _____ million people per year leave their home country for another country |
2 to 4 million |
|
|
|
Migration of a young labour force to selected high income countries leaves many older adults in low and middle income countries with.... |
Fewer people to provide professional and personal care |
|
|
|
Internationally, migration is at a ________ |
All time high |
|
|
|
Urbanization is a global phenomenon with about ______ of global population living in an urban area (projected to increase) |
50% |
|
|
|
Rural ares have a higher _________ of older people, while urban areas have a higher ___________ number of older people |
Rural: higher proportion Urban: higher absolute number |
|
|
|
Working at older ages is ________ in developing countries but ______ in more developed countries |
Declining in developed countries Rising in more developed countries |
|
|
|
According to ILO, the Labour force participation of the older population ________ from 1990 to 2005 and is projected to remain relatively stable until 2020 |
Declined |
|
|
|
Declining fertility rates has led to...... |
Greater female labour force participation |
|
|
|
Gains in healthy life expectancy appear to provide a boost in saving rates as people .... |
Accumulate more wealth in expectation of a linger future |
|
|
|
Encourage longer work lives |
Increase retirement age Changes in pension policies |
|
|
|
Low to middle countries are now dealing with ...... |
Infectious diseases/ malnutrition and non-cummicable diseases/ obesity or being overweight |
Disease Eating |
|
|
Double Burden of Disease |
Despite issues of malnurishment, undernutrition, and hunger in developing countries, there is a rapid increase in overweight persons and obesity in many low to middle income countries where people are beginning to consume more empty calories and chemically processed foods, resulting in an increased risk of non-communicable diseases as well (e.g., diabetes, heart disease) |
|
|
|
Emerging issues in global healthcare (arguments) |
-elderly population will be a burden on healthcare systems -Aging population will inevitably render healthcare unaffordable -long-term implications of providing healthcare to the aging population (i.e., inpatient, outpatient, Community, home care) -resulting increase in people surviving into old age will increase cost to the taxpayer |
|
|
|
Social inequality in a country is a ____________ ___________ of the health of the population of the country |
Significant predictor |
|